If a crash happens away from your debugger, the job becomes two separate problems: getting the report and then turning the raw addresses back into code locations.
That is the split this article handles well. First it shows where crash logs can be found, depending on whether the phone is connected to Xcode or only available on its own. Then it walks through symbolication, which is what turns anonymous memory addresses into useful symbols and source-level clues.
The article frames three practical retrieval paths:
debug while the device is connected to Xcode, inspect a symbolicated crash in Xcode's device logs, or pull an unsymbolicated crash straight from the phone and decode it later with the matching dSYM.
The easiest path is still the connected-device flow inside Xcode.
If you can reproduce the problem with the phone plugged into your Mac, Xcode can surface the device logs directly and usually show them in a symbolicated form right away.
The article's path is:
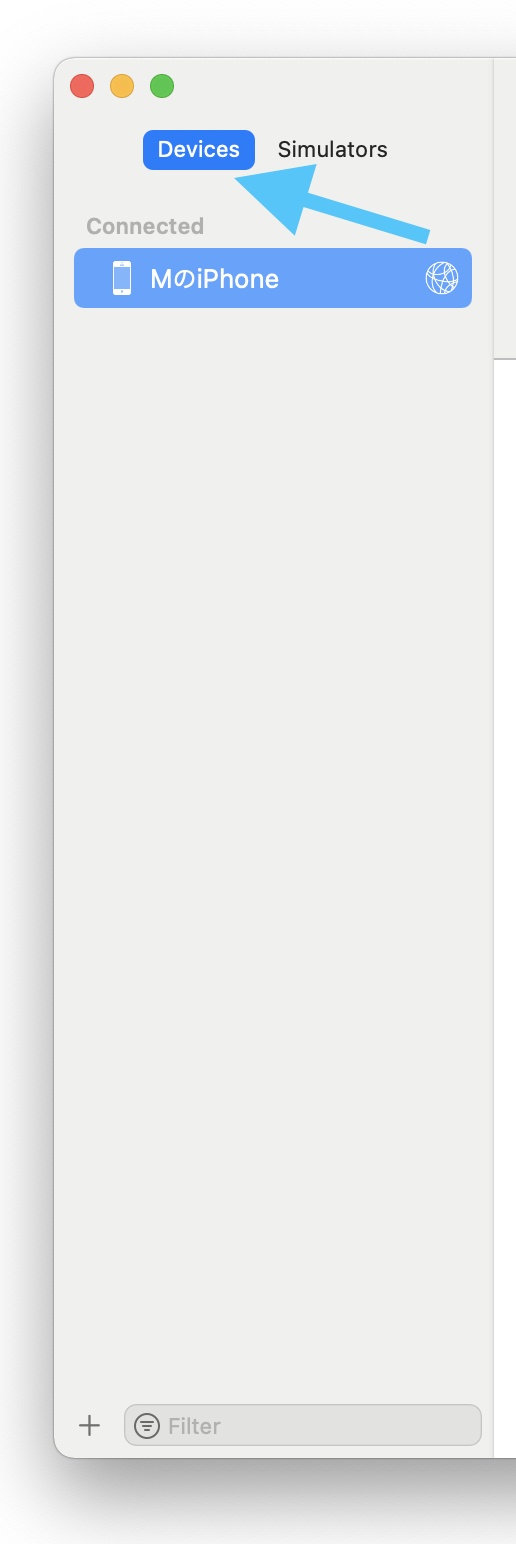
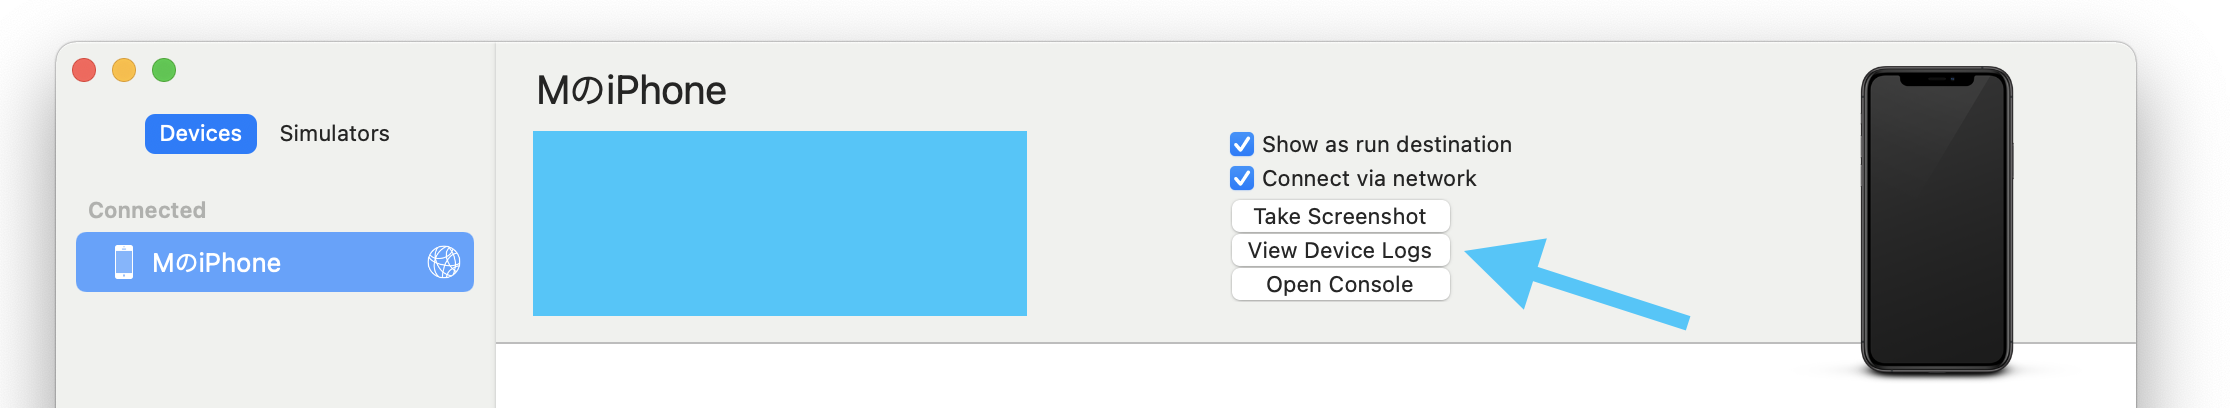
open Window > Devices and Simulators, choose the physical device in the left sidebar, then click View Device Logs.
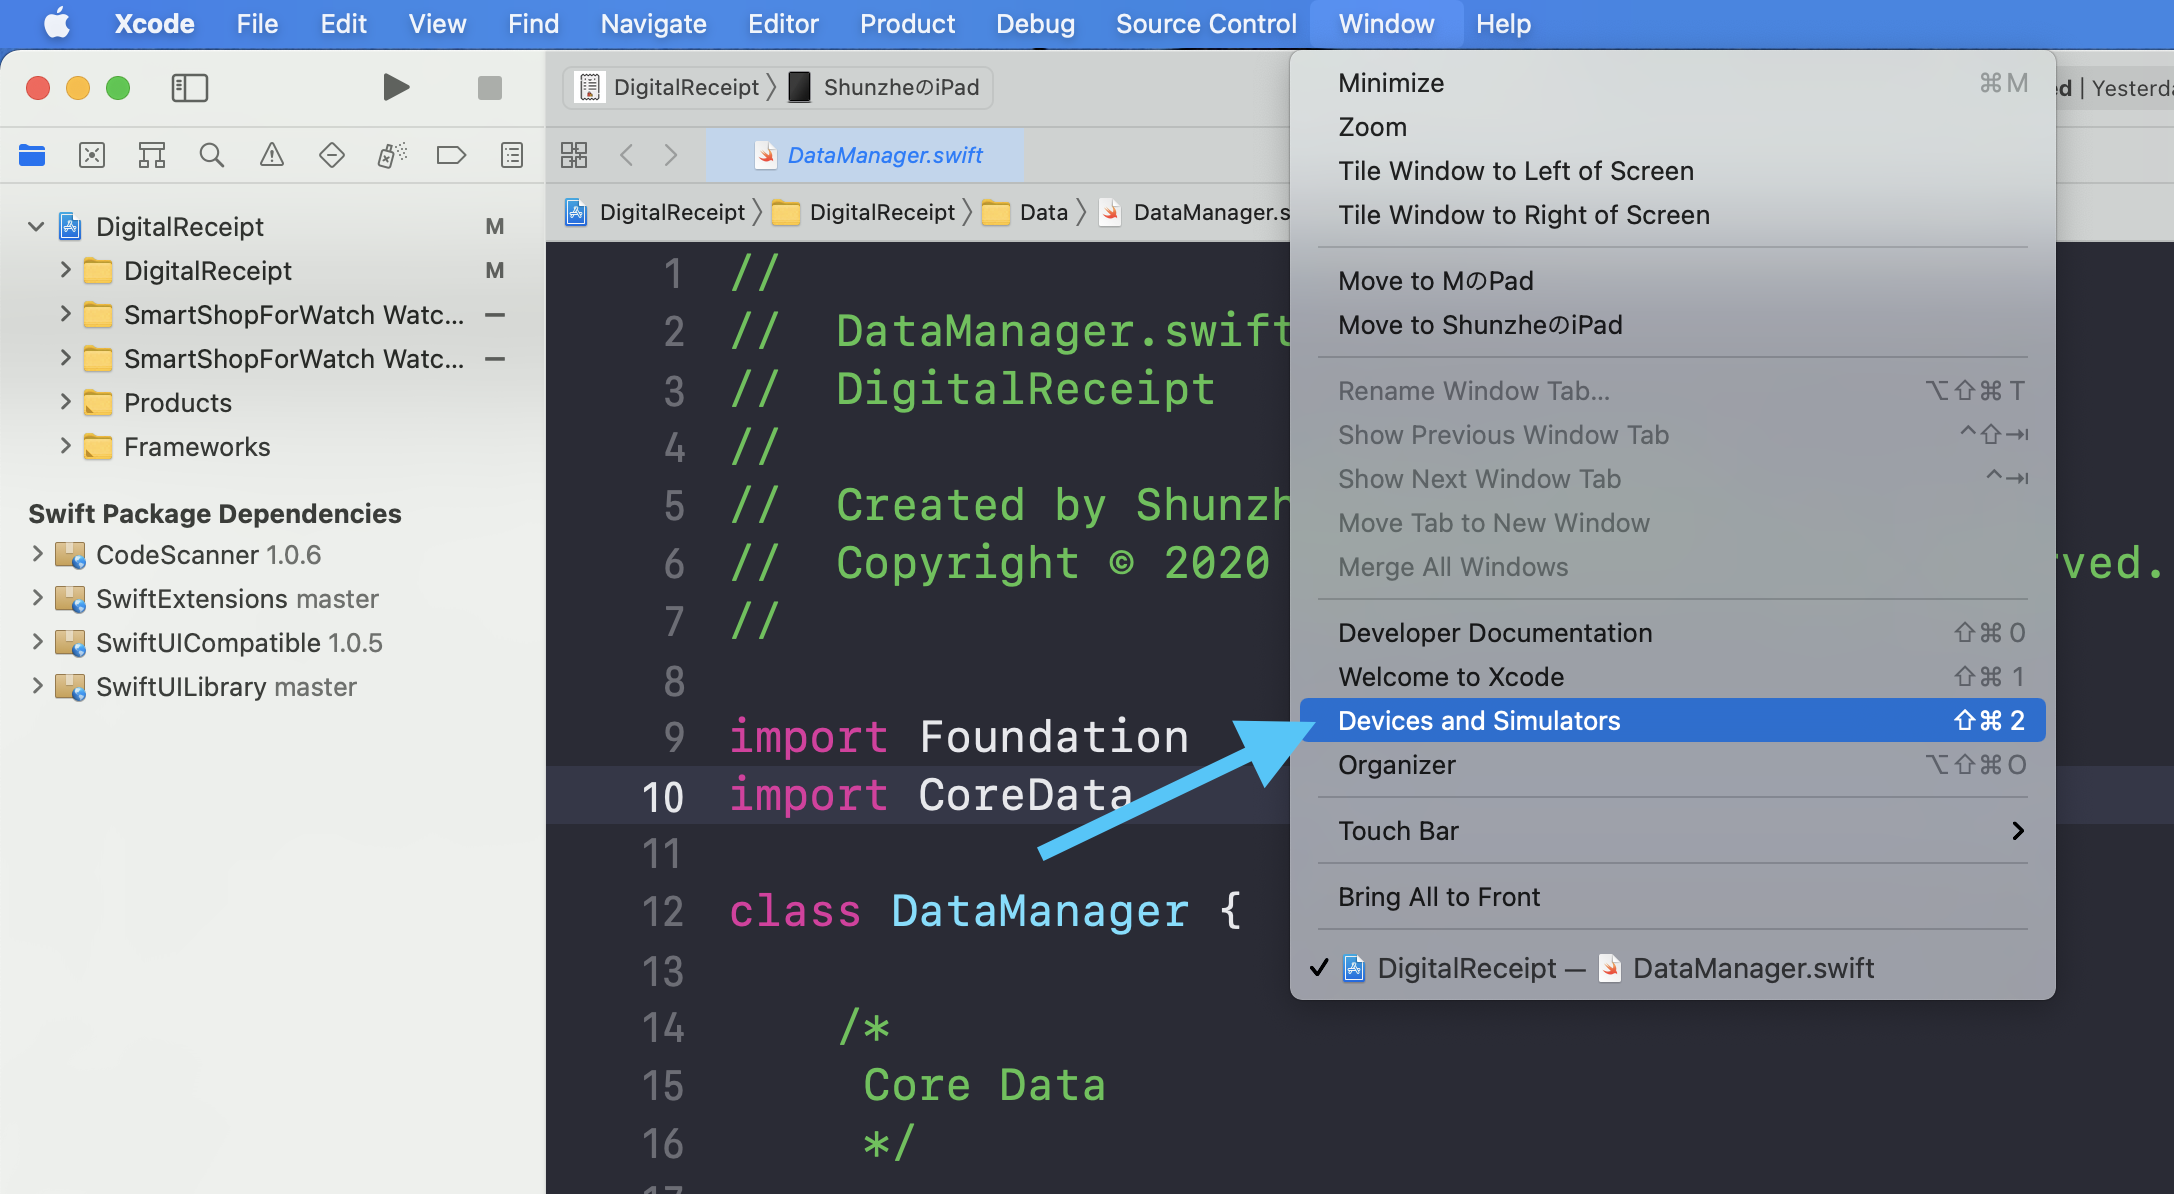
This is the least painful path because Xcode is already holding the relevant build metadata and symbol files for recent local builds.
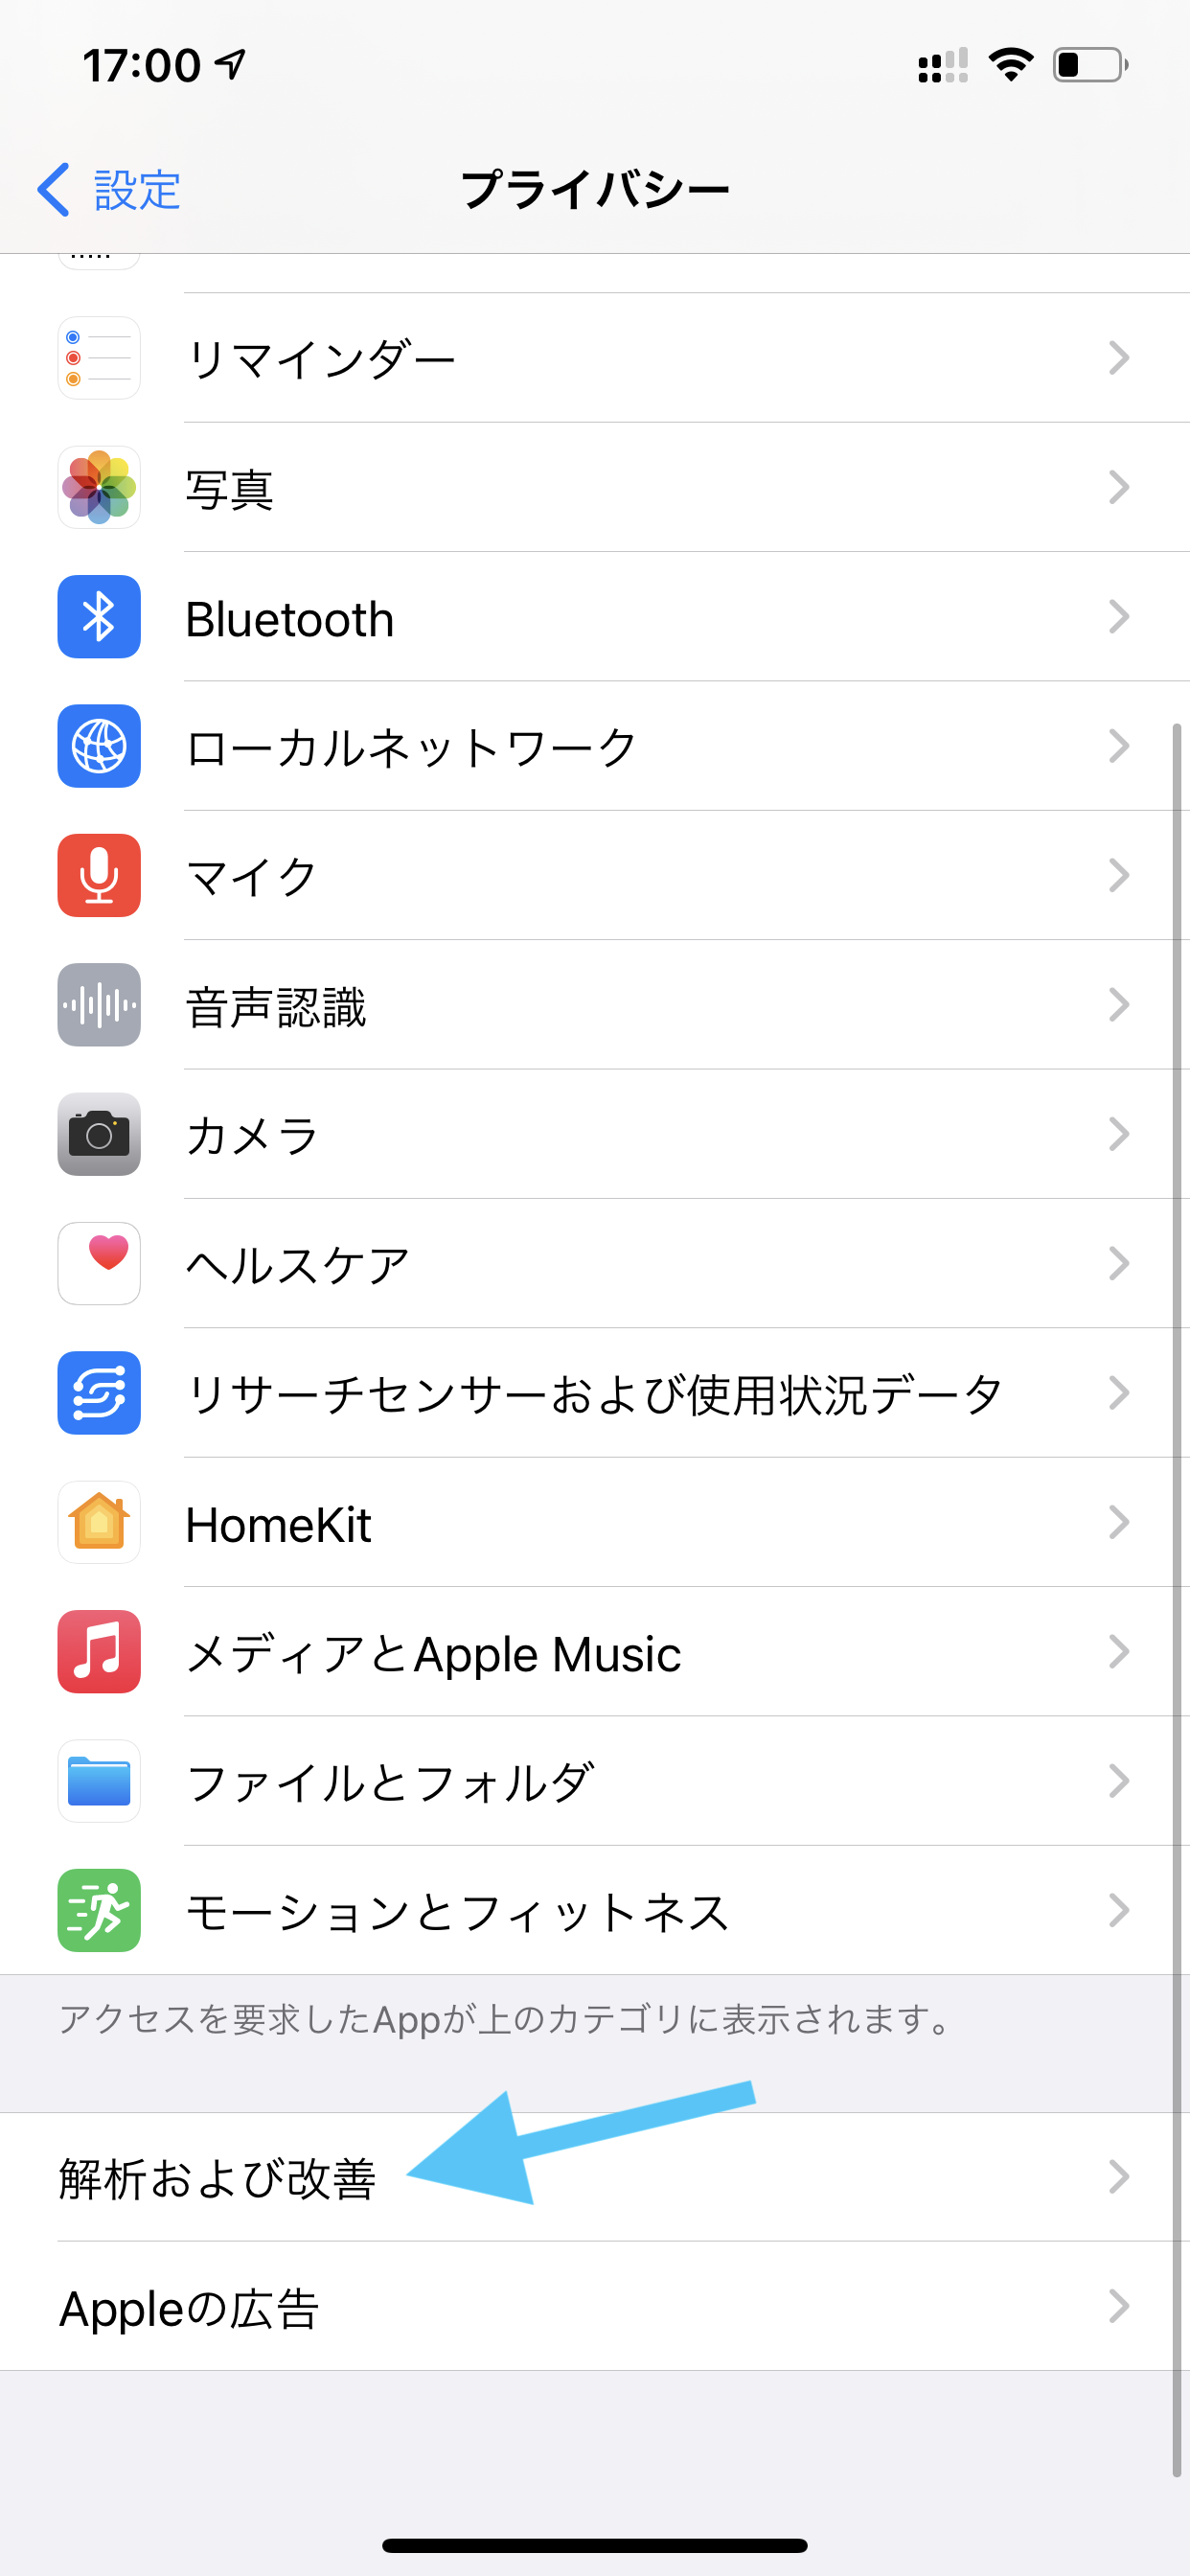
If Xcode is not involved, the phone itself can still provide the raw crash report through Analytics Data.
That route is useful when the crash happened in the field or when someone else is sending you the report. The log you get there is not the friendly final answer yet, but it is enough to decode later.
The path in the article is:
Settings → Privacy → Analytics & Improvements → Analytics Data.
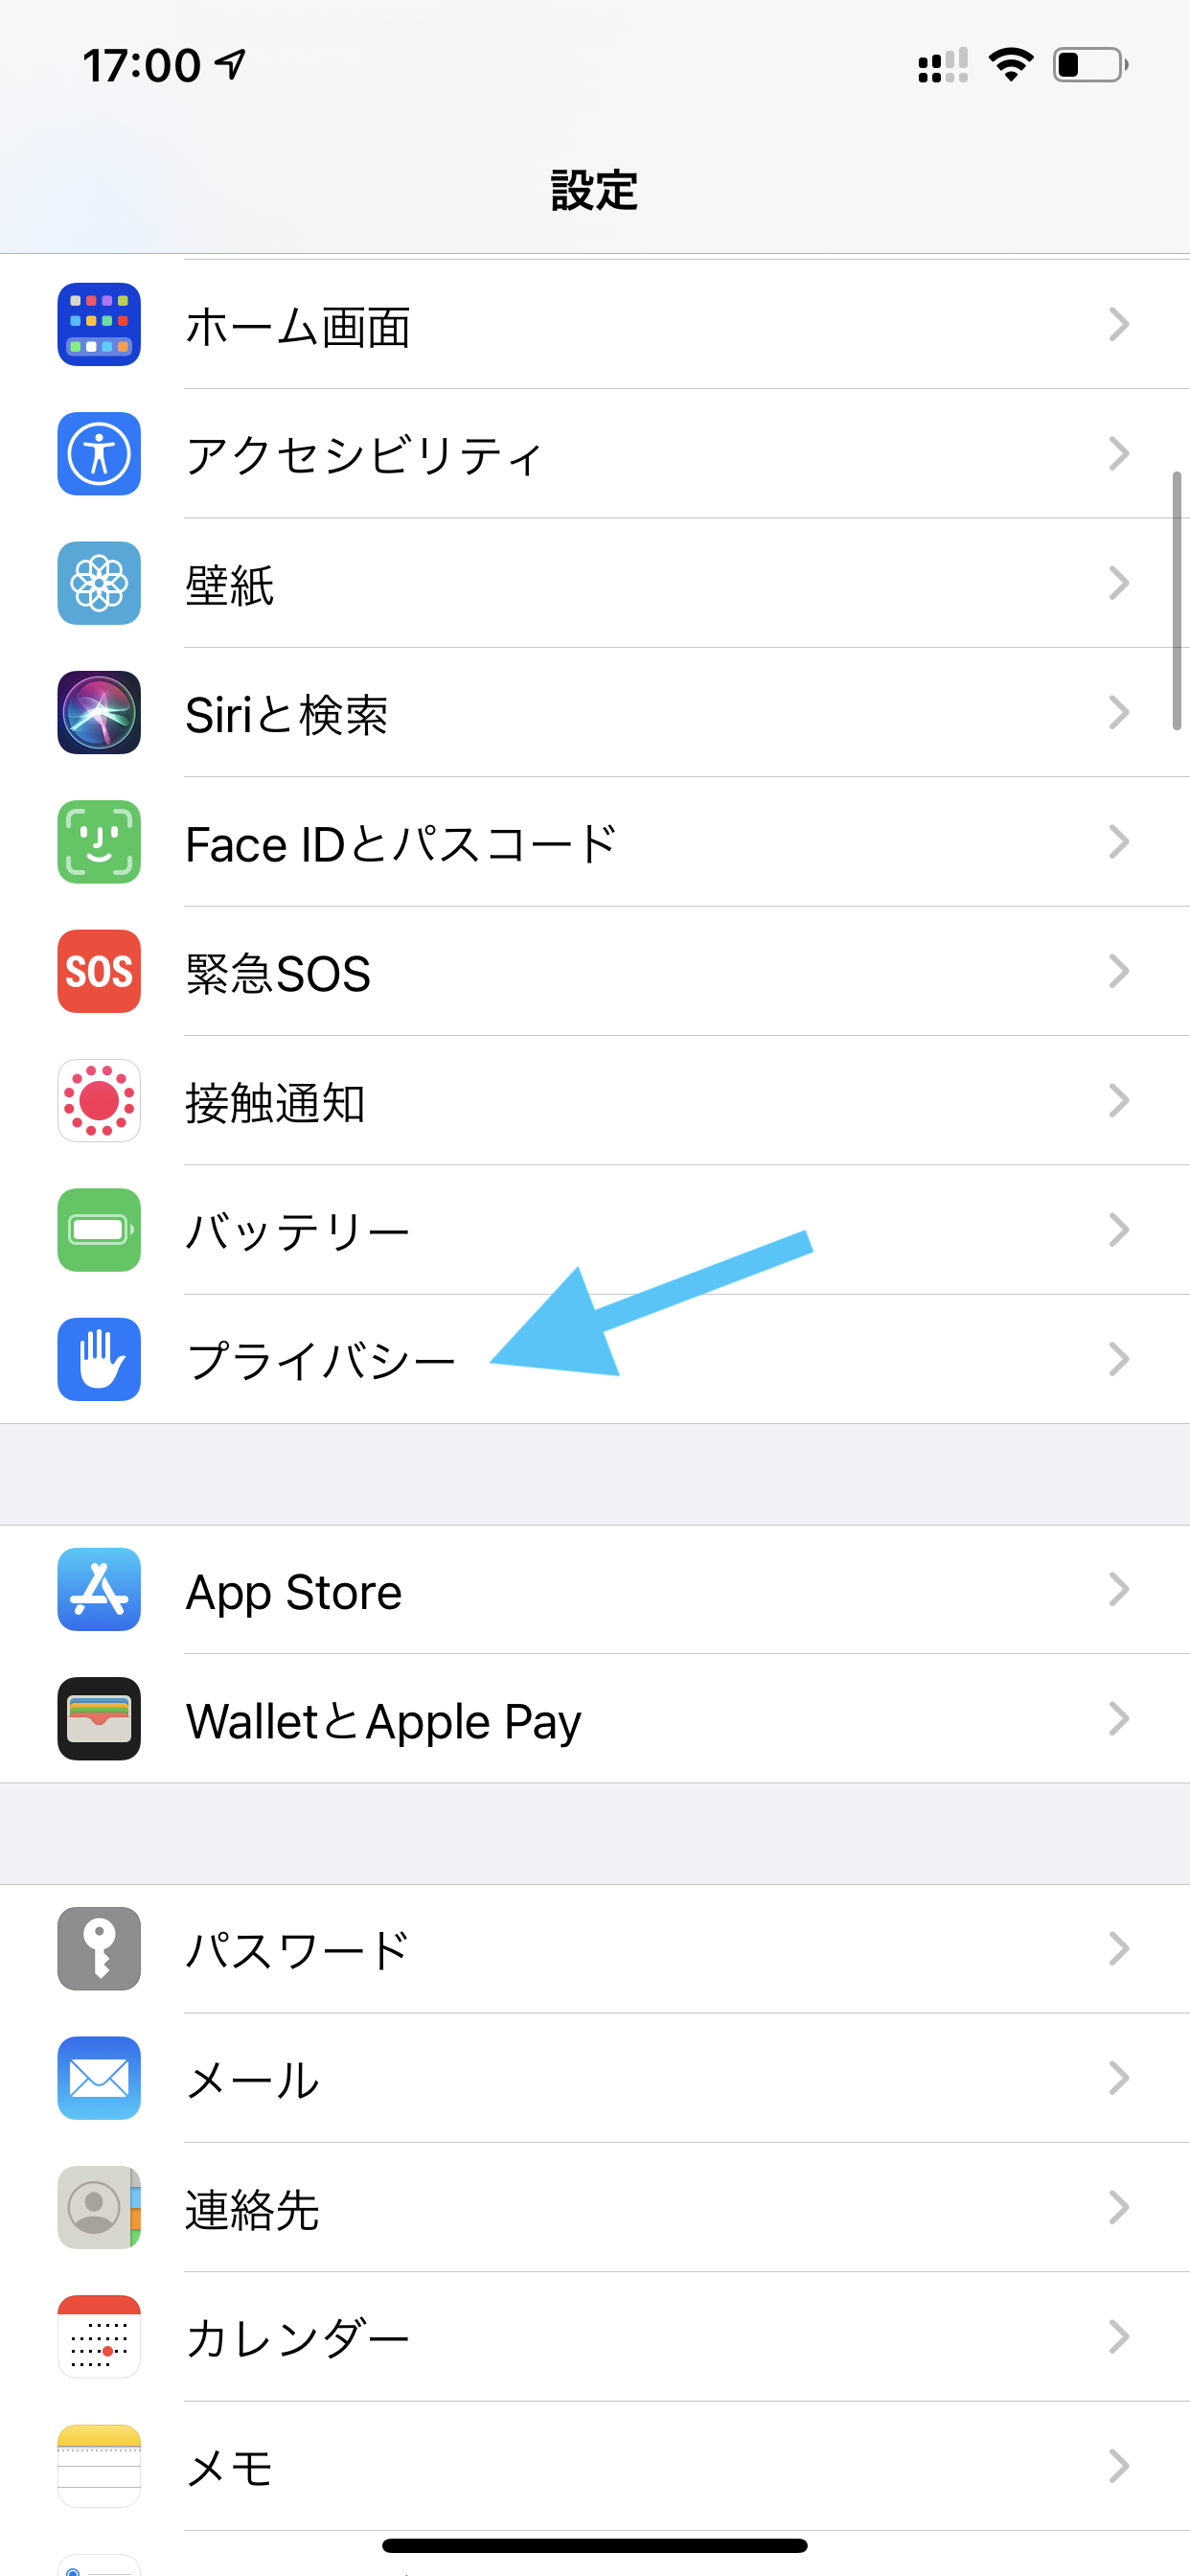
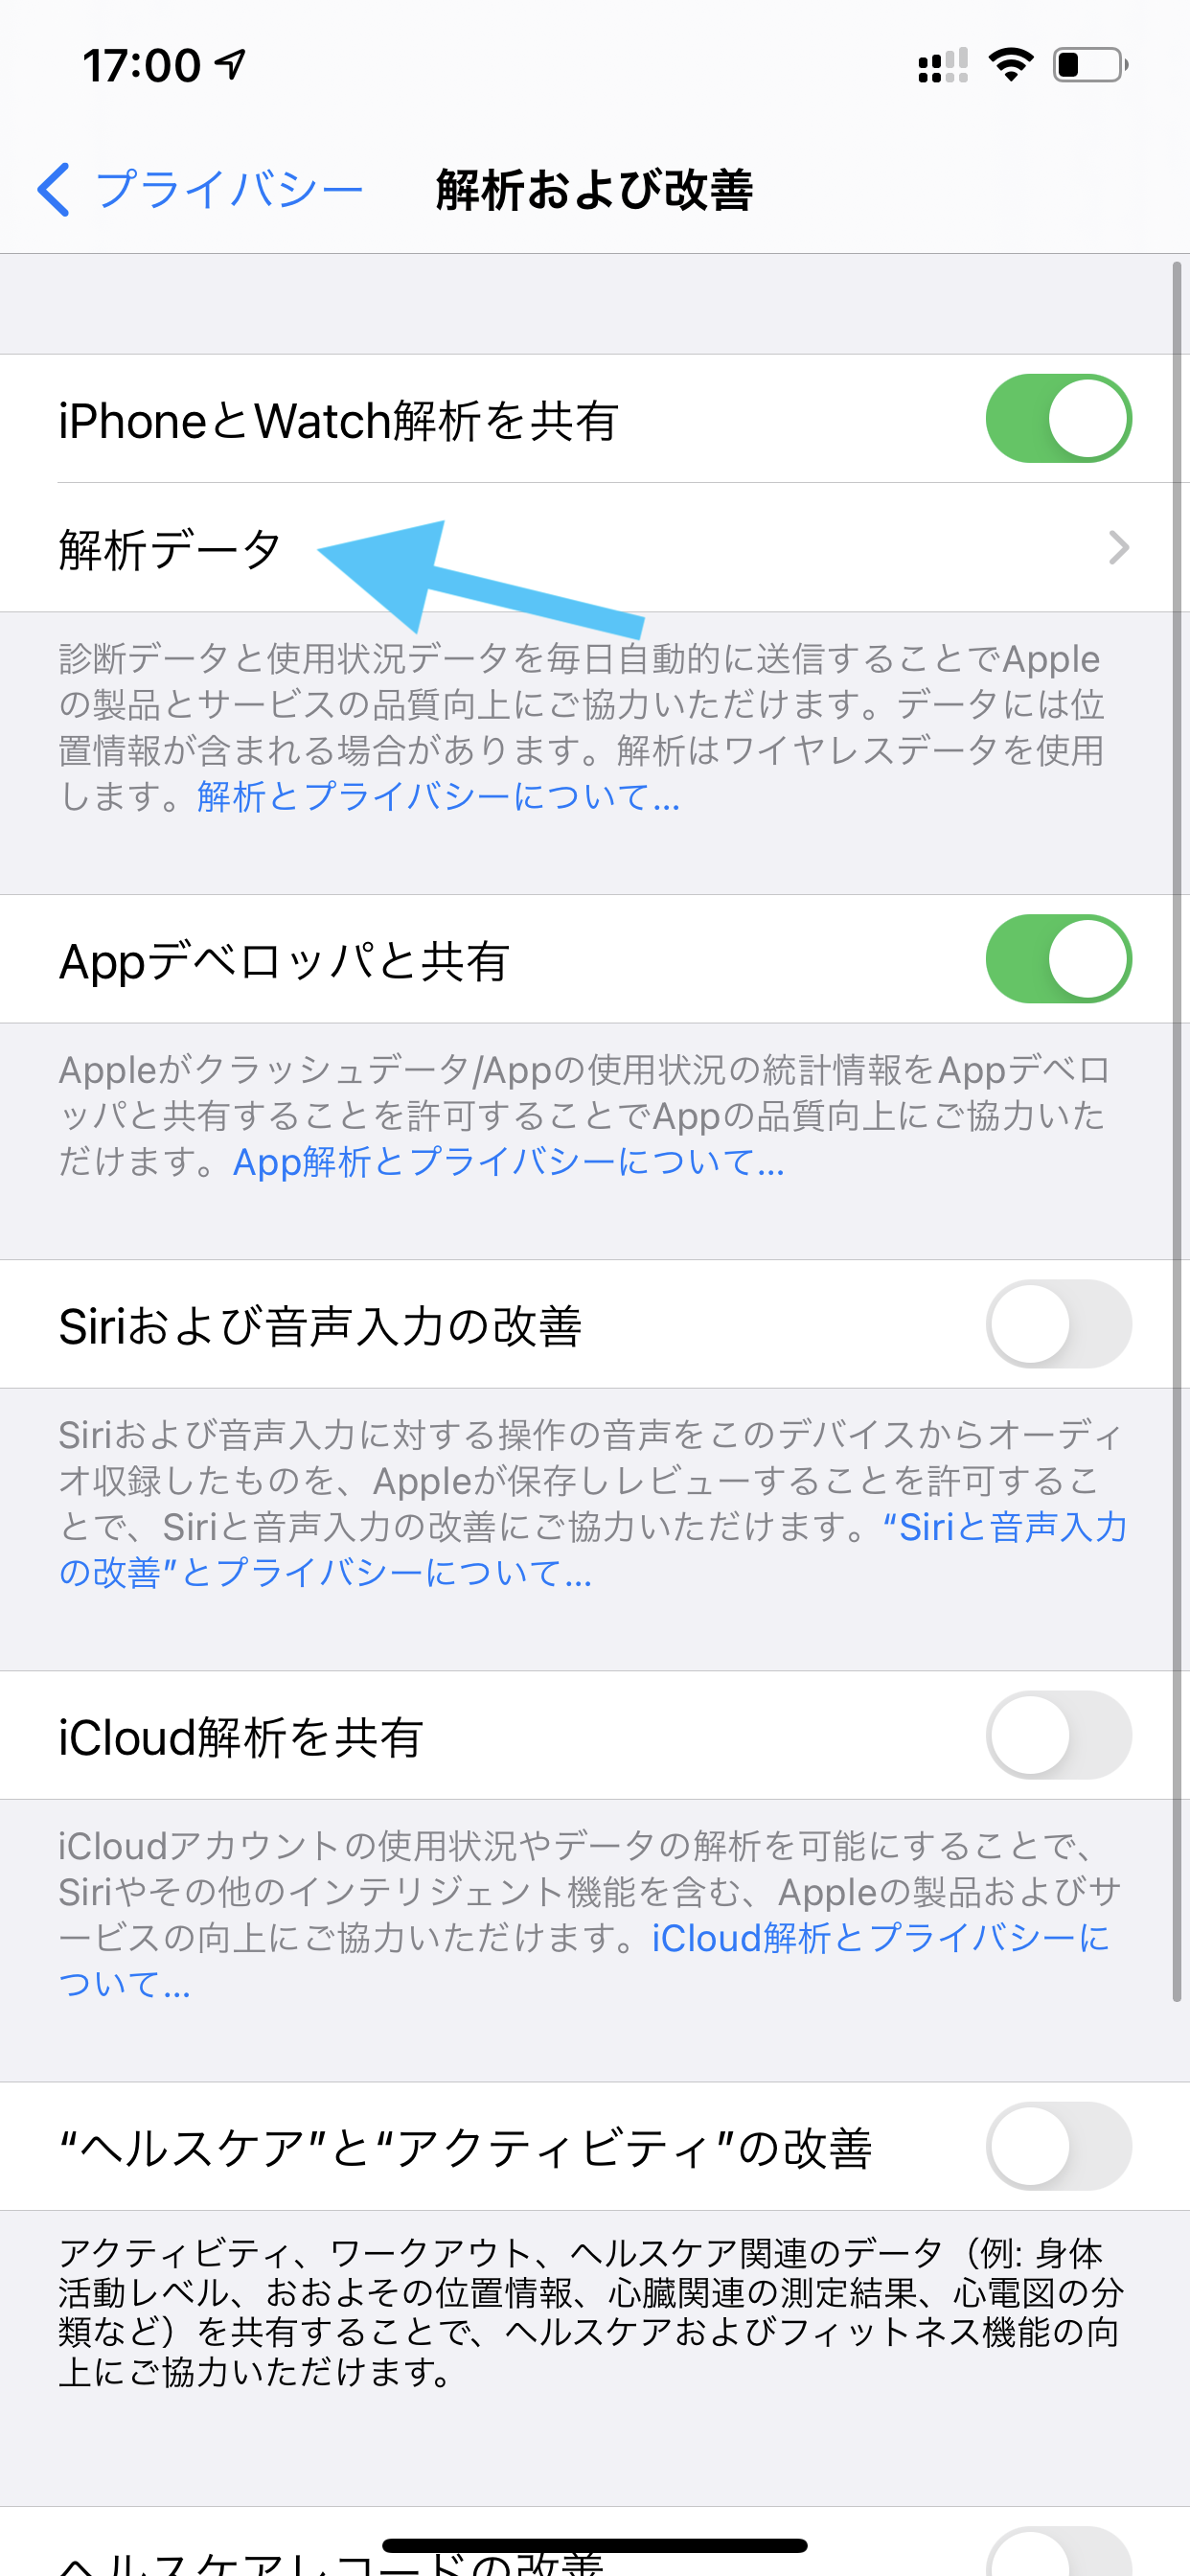
Analytics Data is the log list view.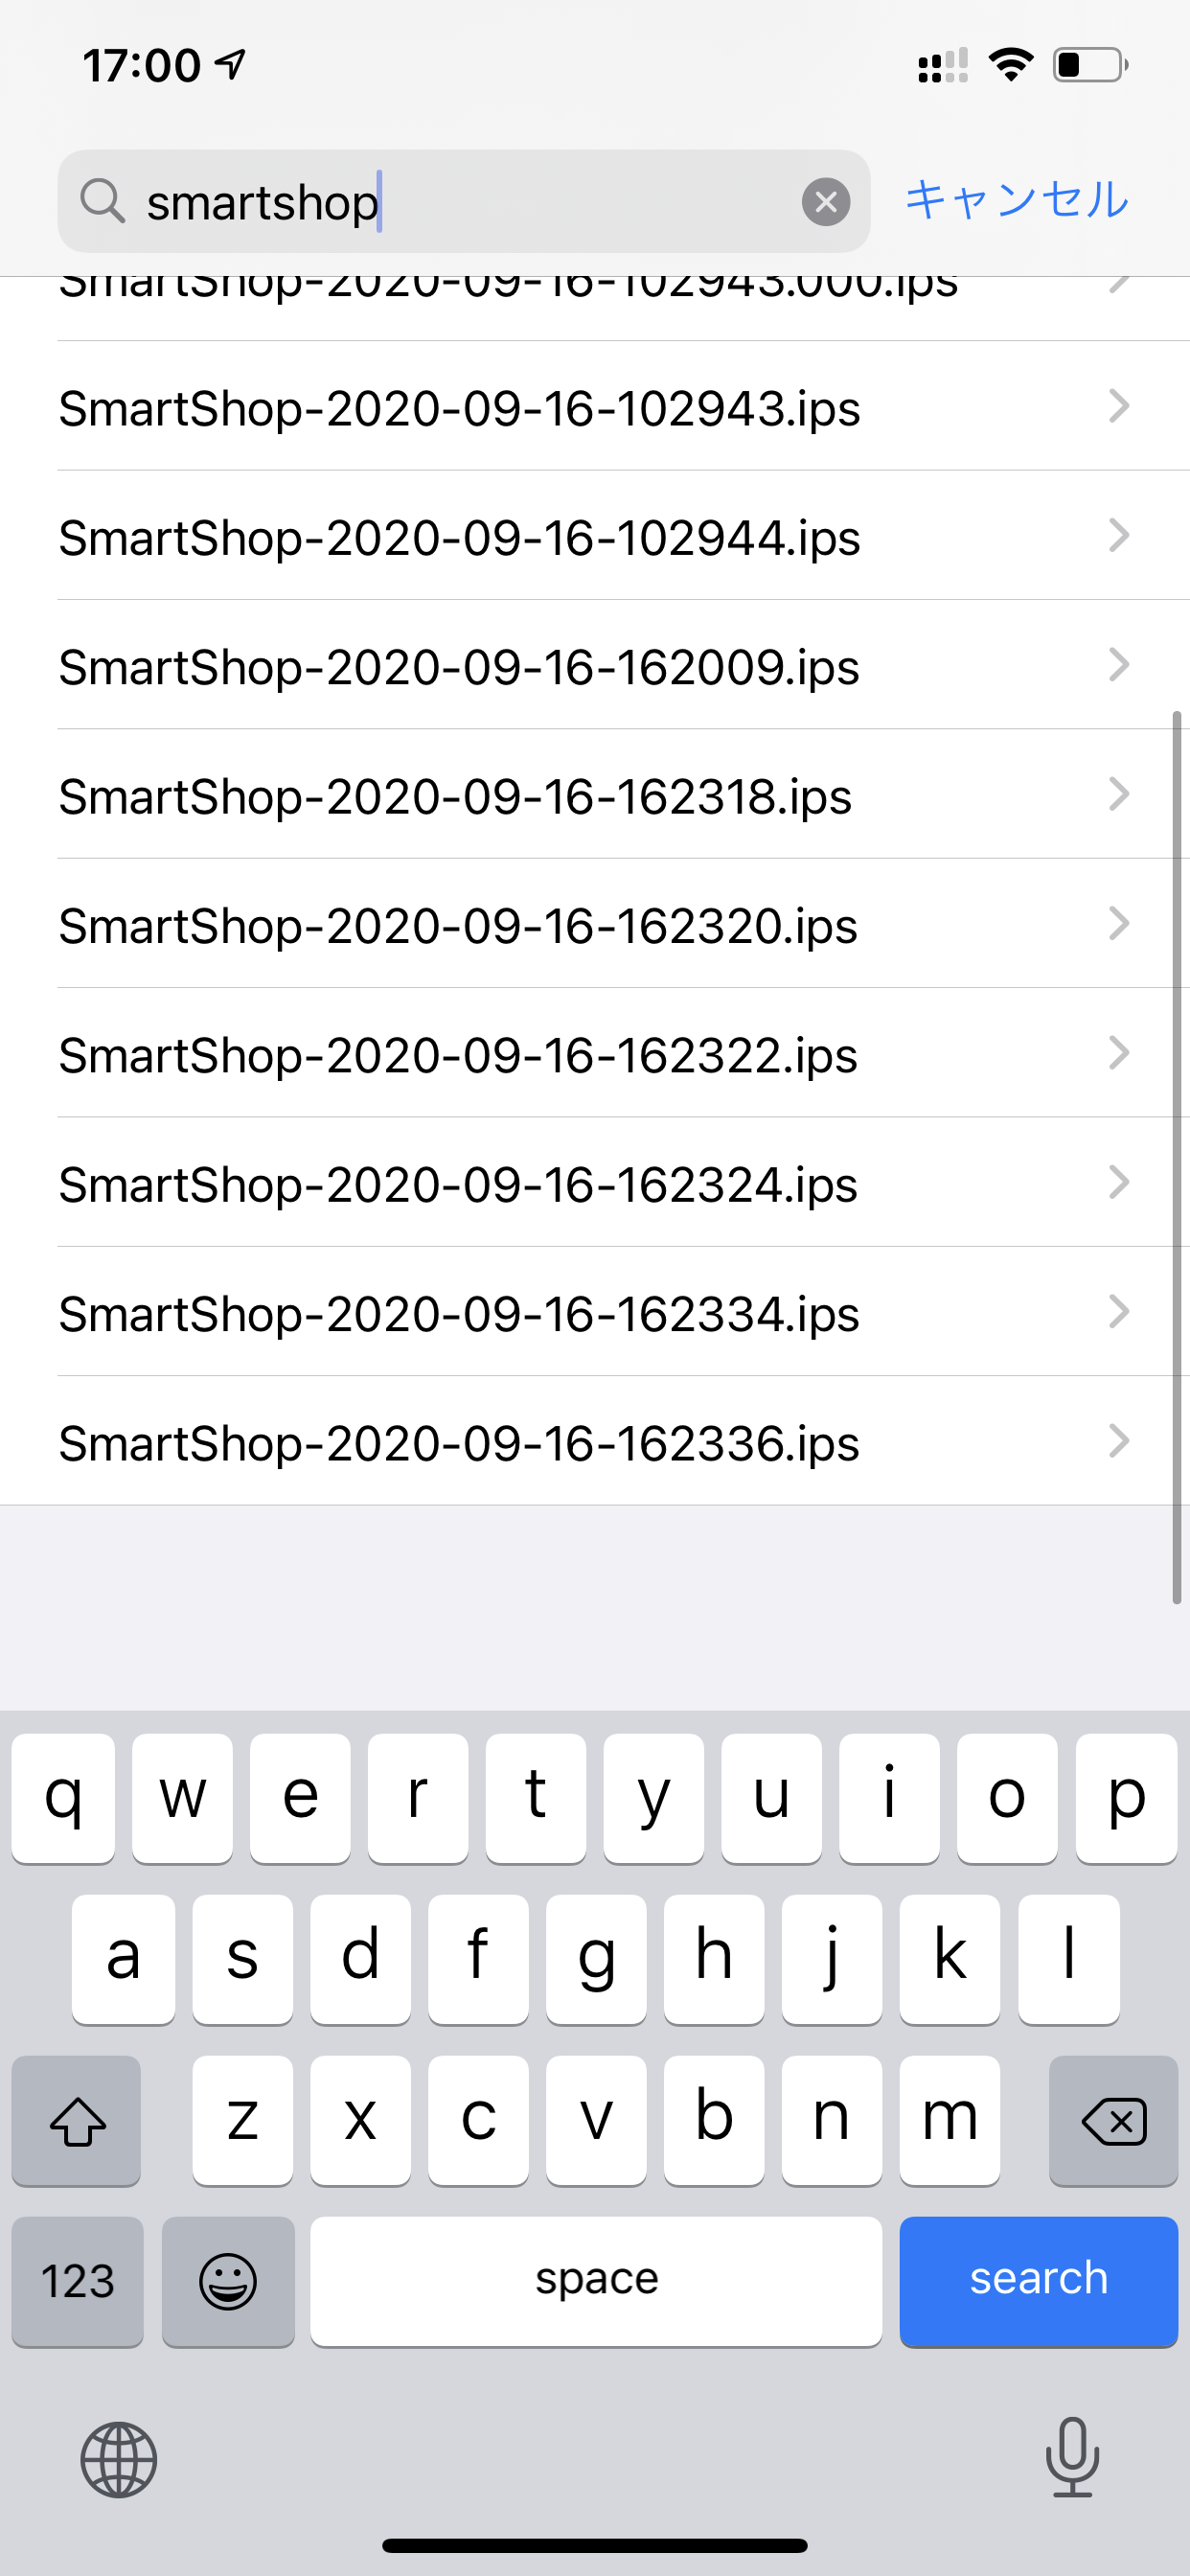
If the matching archive is still available, Xcode is often the shortest route to a readable crash.
The article distinguishes between already-symbolicated logs in Xcode and raw reports coming from somewhere else. For the latter case, the next problem is making sure you have the right archive and dSYM for the exact build that crashed.
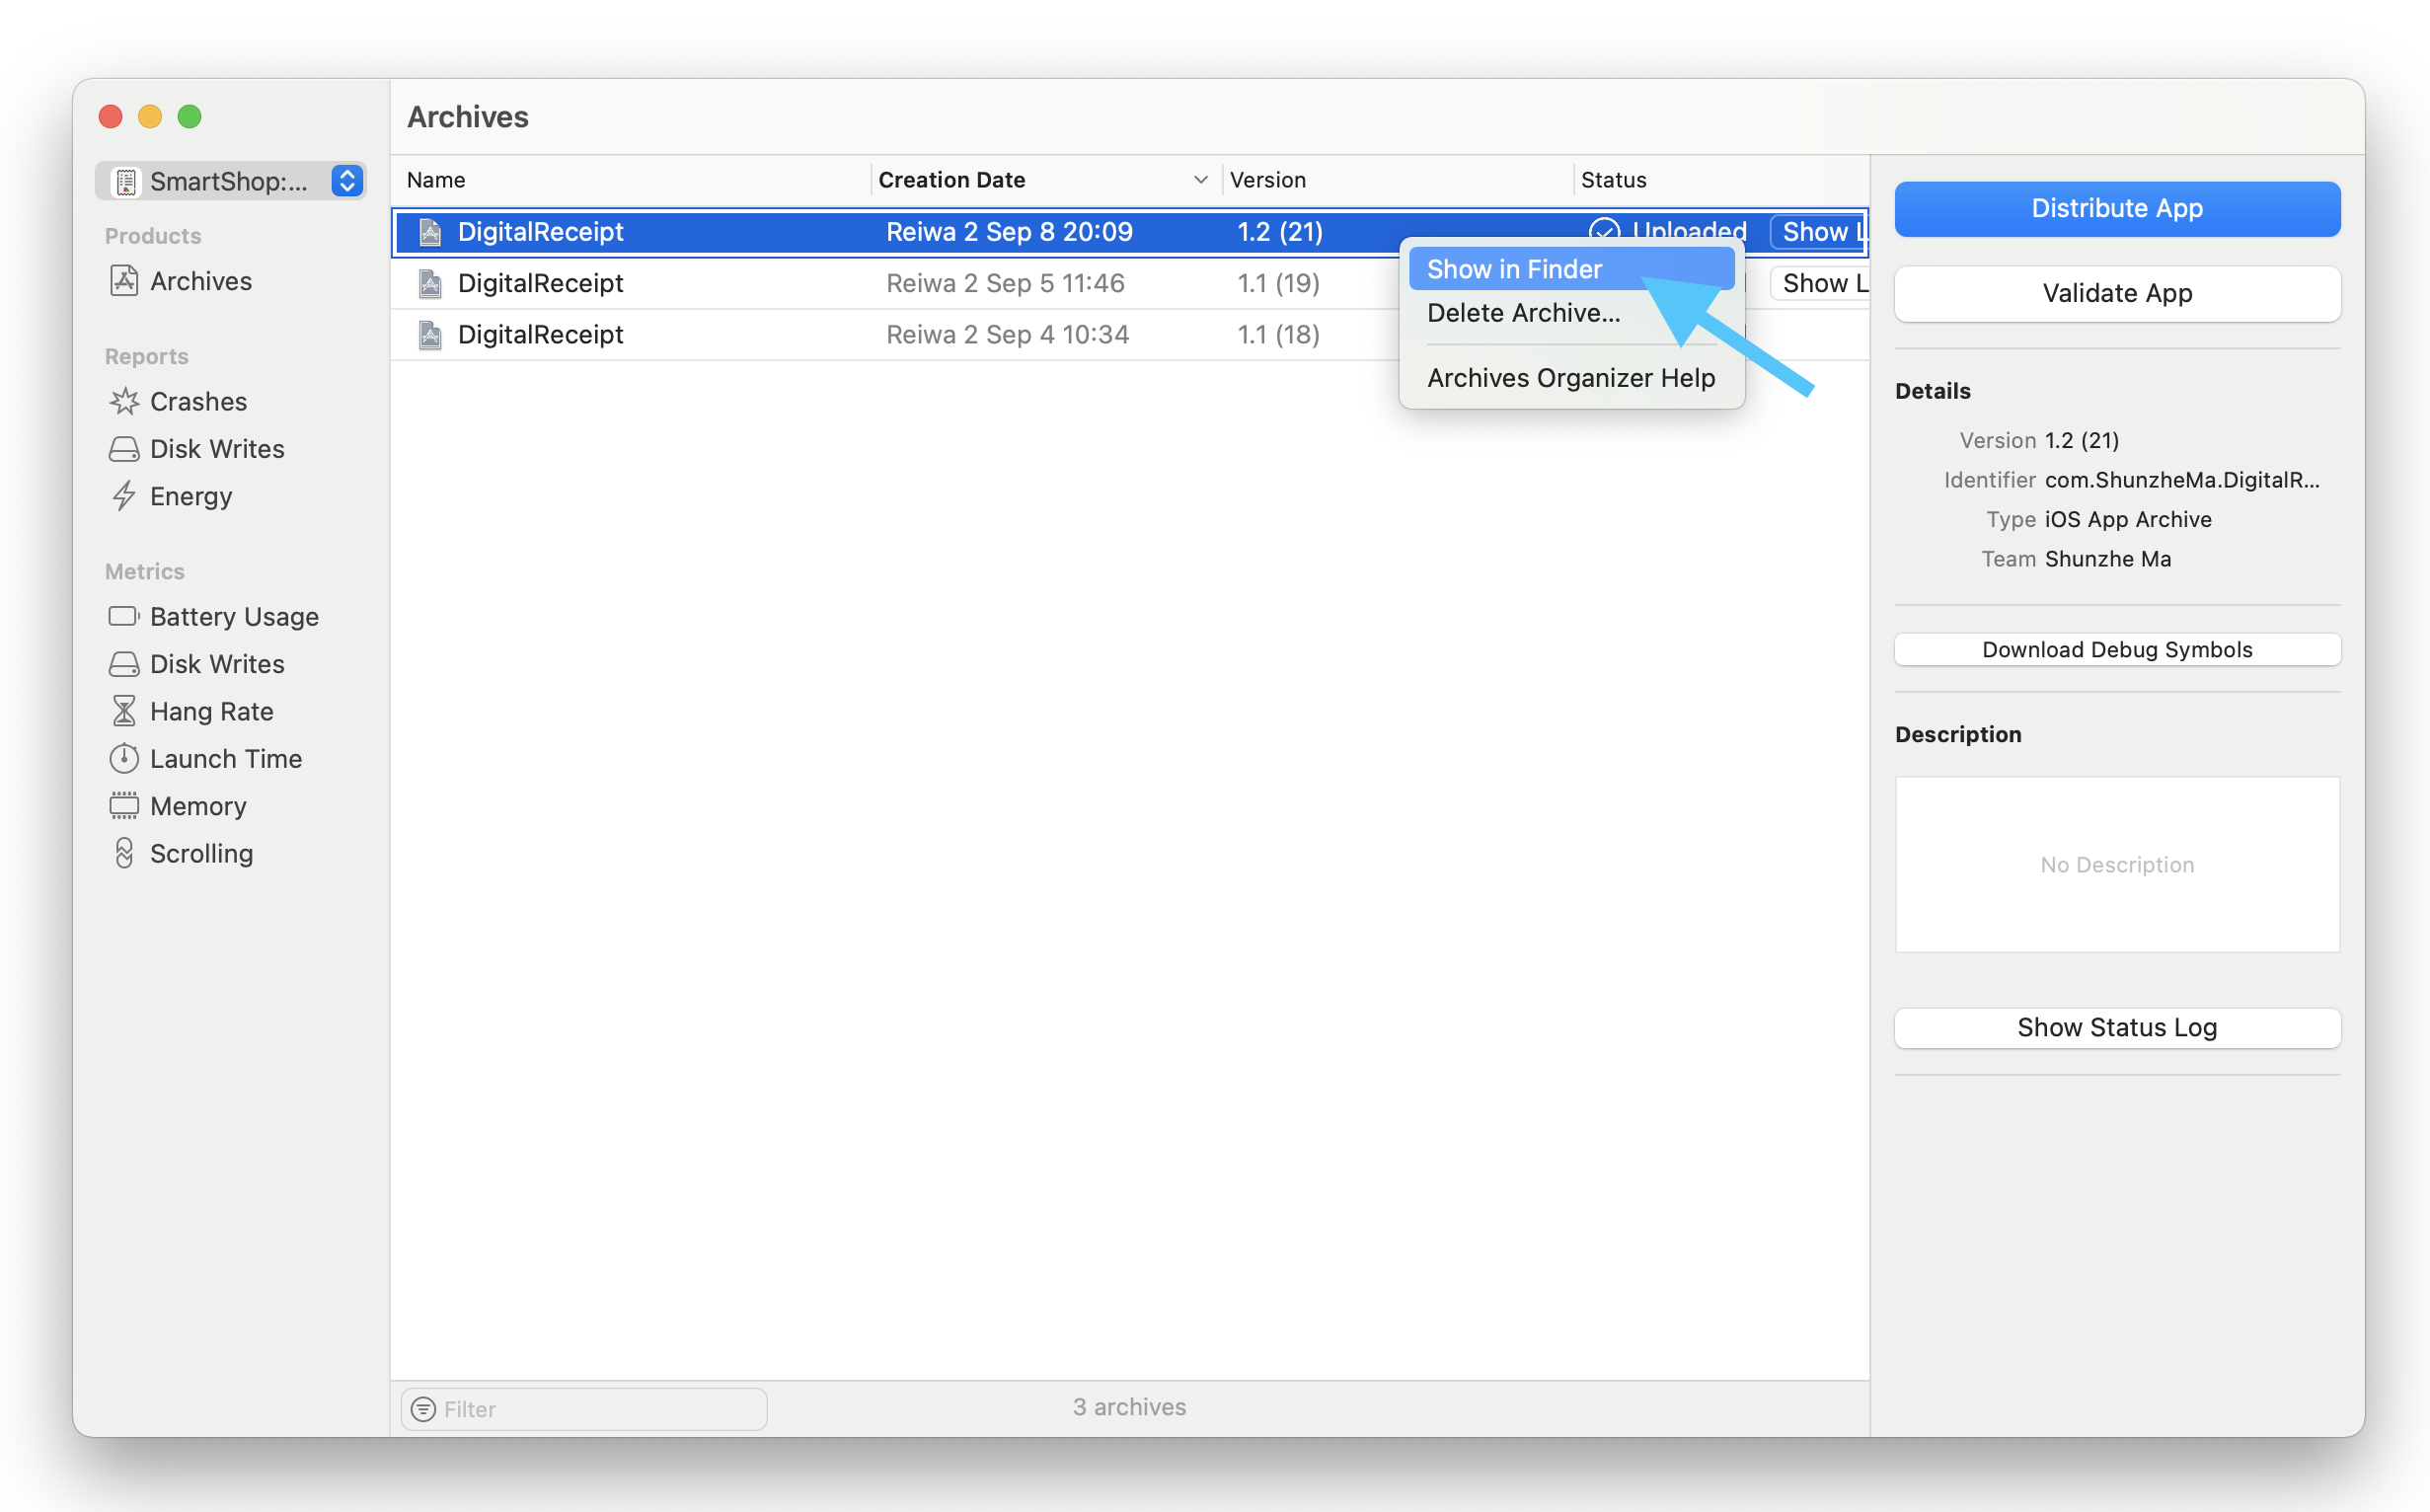
If you archived the build, you can start from the Organizer or from the archive package itself and work outward from there.
Everything depends on matching the crash report to the correct dSYM.
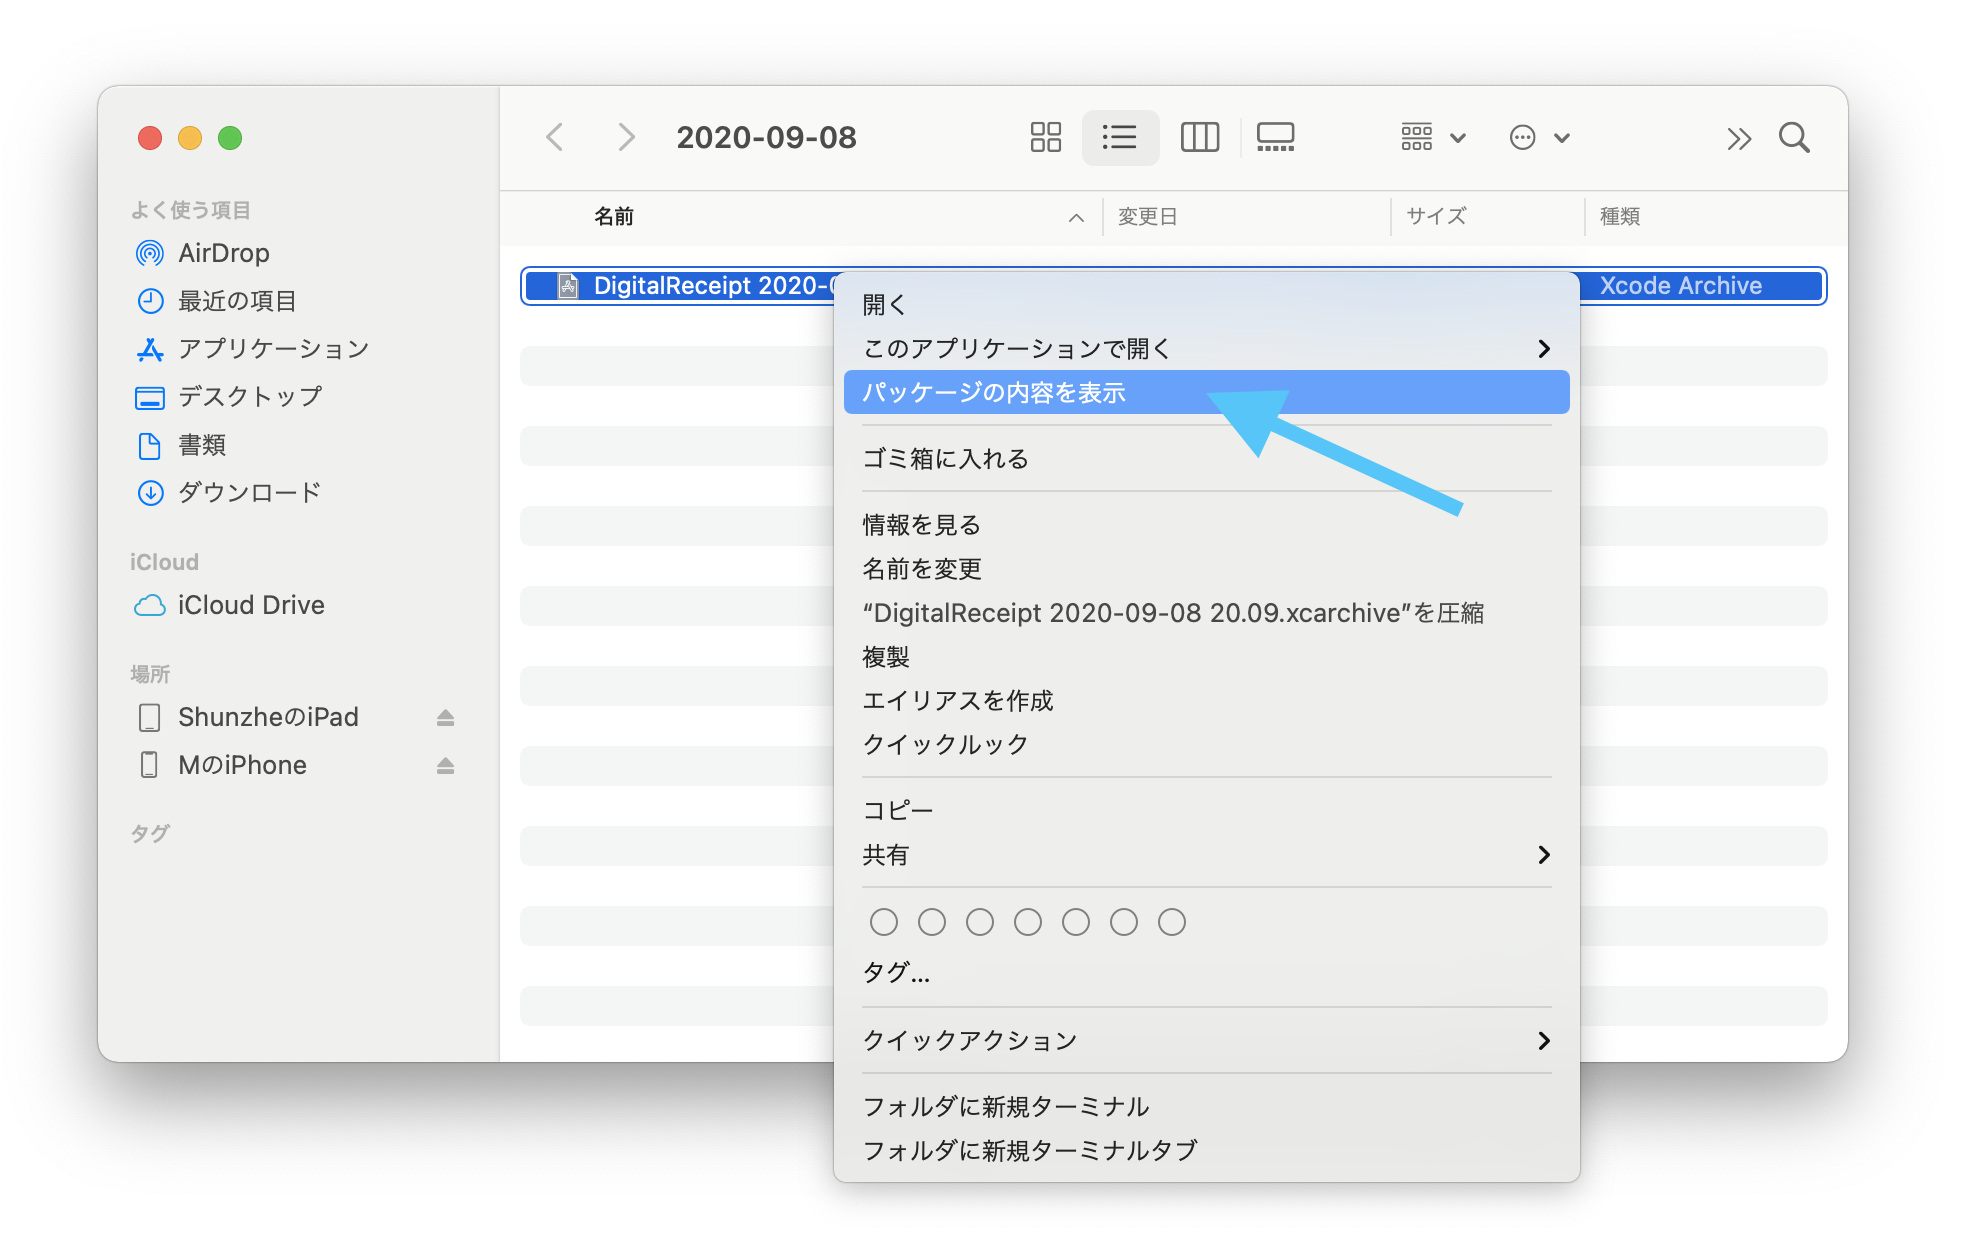
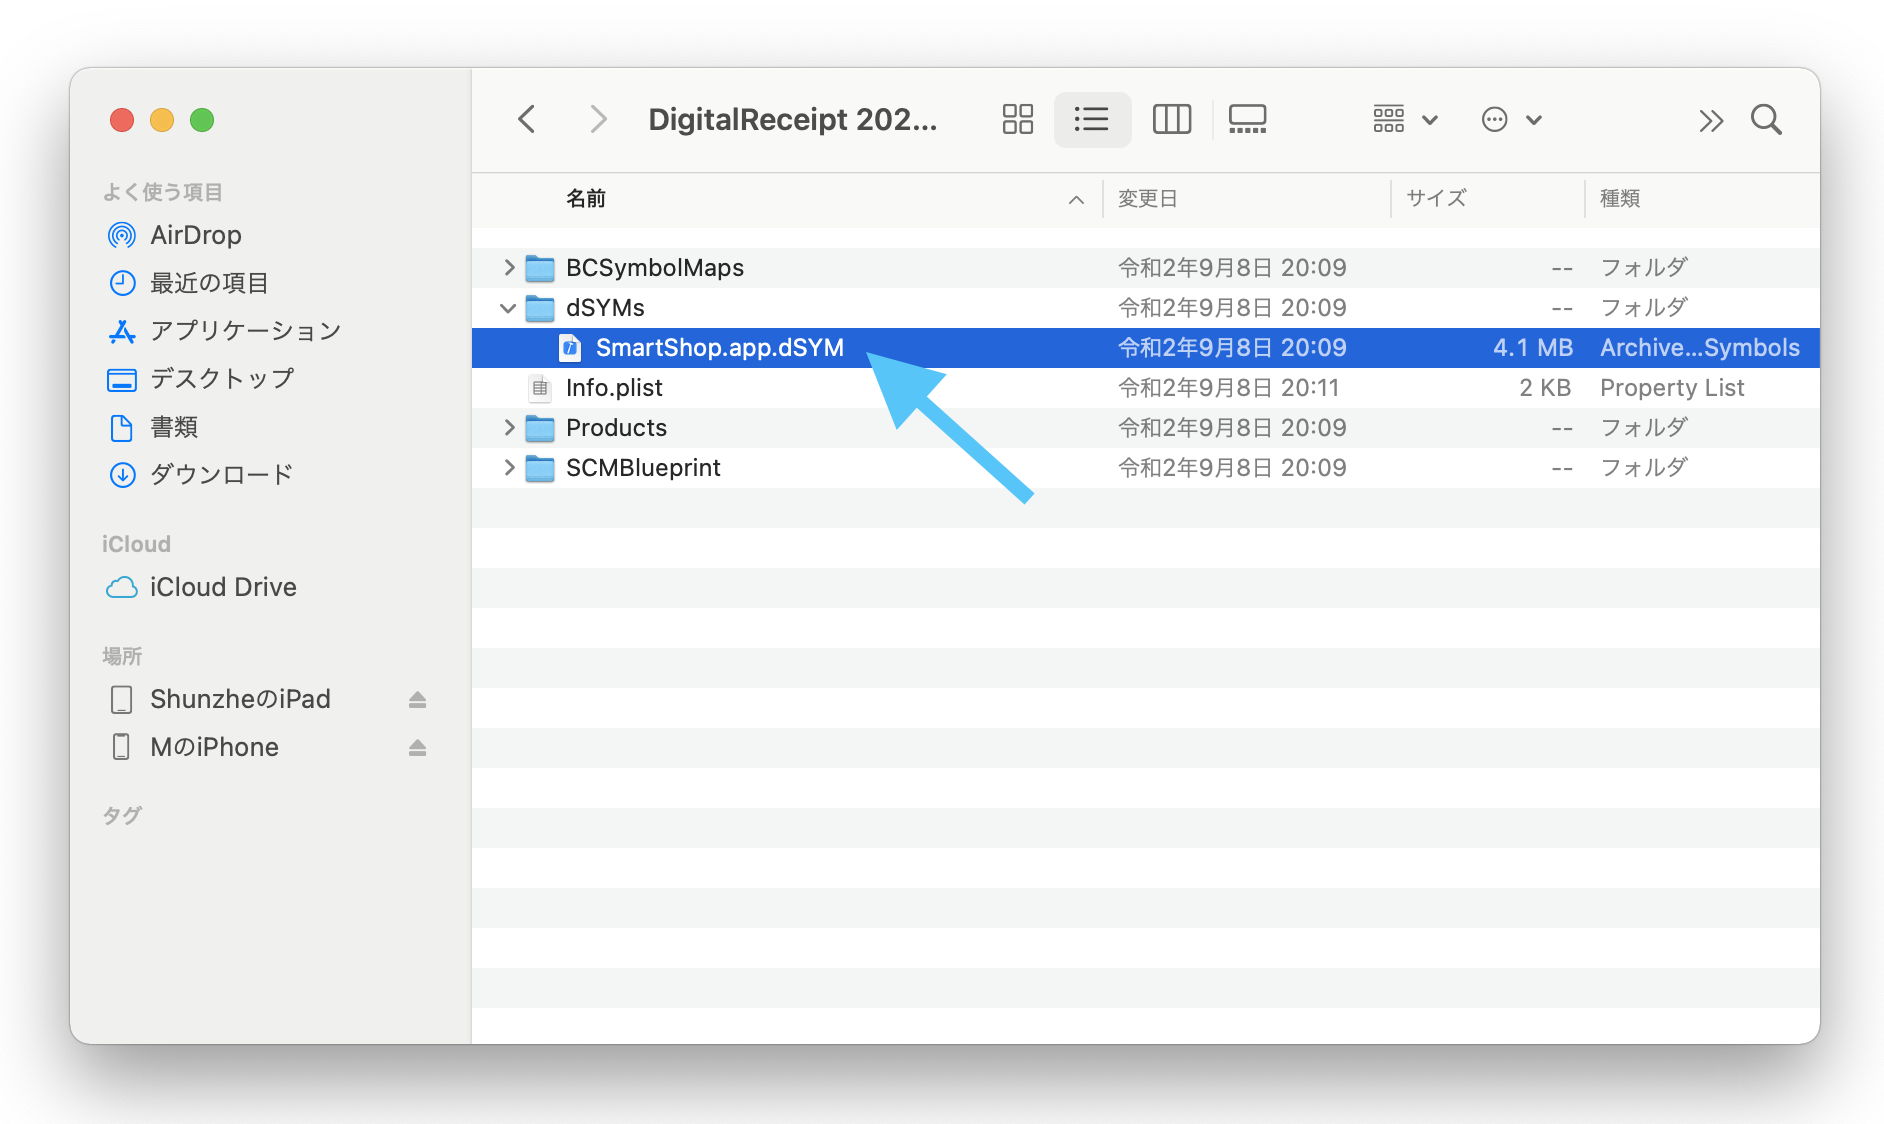
The article first shows the manual archive route. In Finder, open the archive package contents, then look for the bundled dSYM file.
The second route is to match by UUID. The article points out that the relevant UUID can be found in the crash report's Binary Images section.
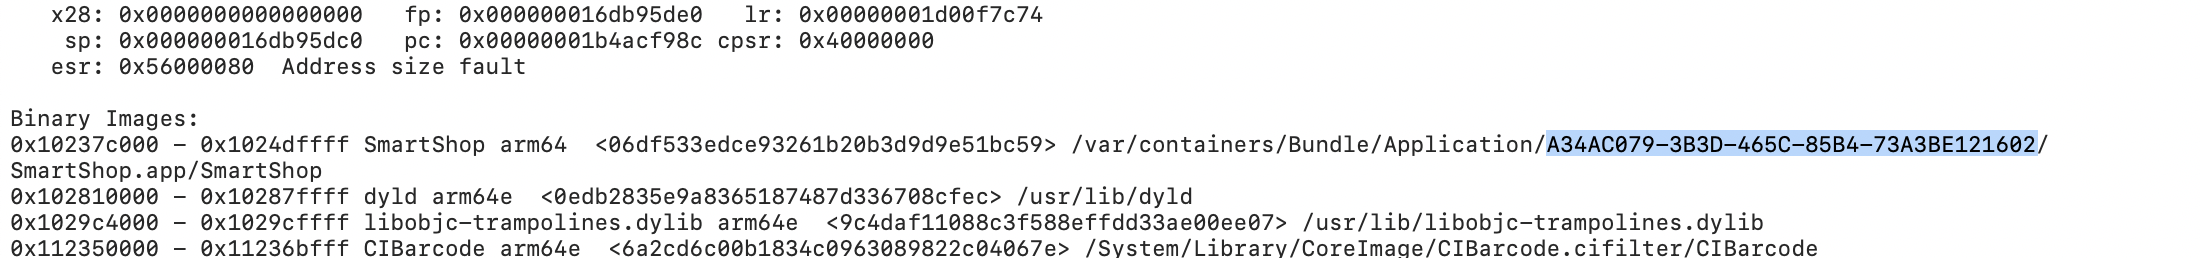
mdfind "com_apple_xcode_dsym_uuids == <UUID>"That search helps when you have many archives or no longer remember where the build artifacts were stored.
The classic command-line path uses symbolicatecrash with the right dSYM and the raw crash report.
This article first exports the Xcode developer directory, then runs the bundled symbolication tool directly from Xcode's framework path.
export DEVELOPER_DIR=/Applications/Xcode.app/Contents/Developer/Applications/Xcode.app/Contents/SharedFrameworks/DVTFoundation.framework/Versions/A/Resources/symbolicatecrash -d <path_to_dsym> -o <output file> <path_to_crash_report>In plain terms:
<path_to_dsym> is the matching symbol file,
<output file> is where the decoded report should be written,
and <path_to_crash_report> is the original raw crash log.
atos is the more surgical option when you want to decode one stack address manually.
This route uses several values taken from the crash report itself: the binary architecture, the load address, and the stack address.
atos -arch <binary architecture> -o <dSYM file path> -l <Load address> <Stack Address>The article points to the exact places those inputs come from inside the report:
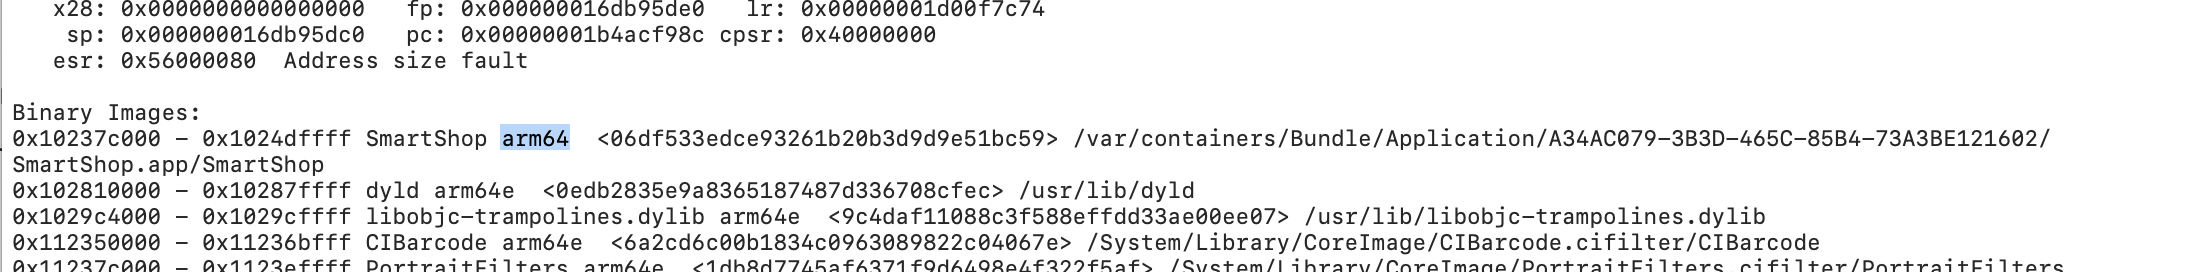
Binary Images block.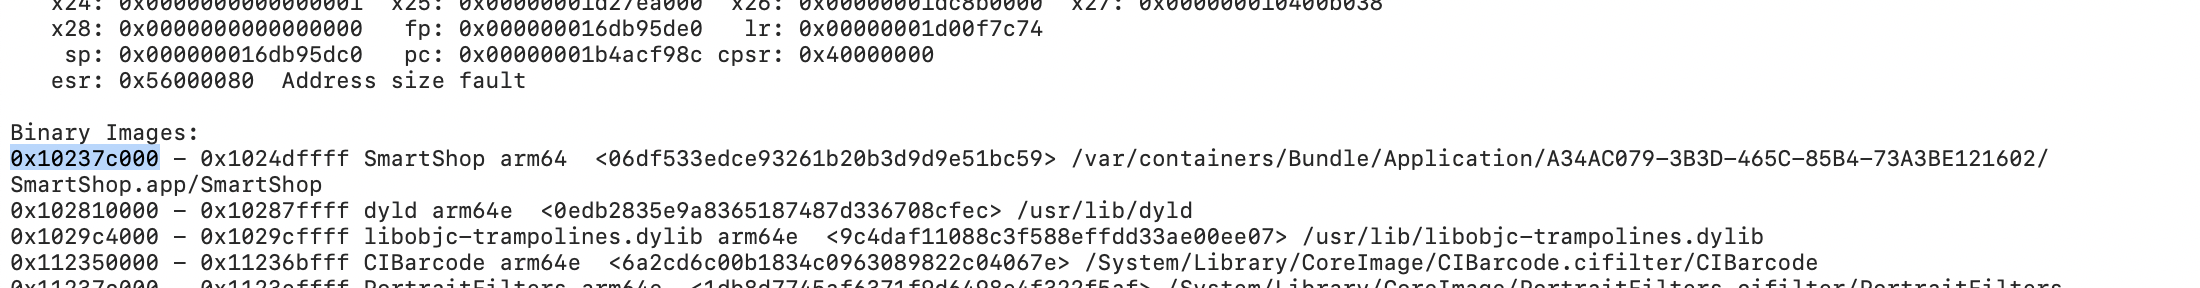
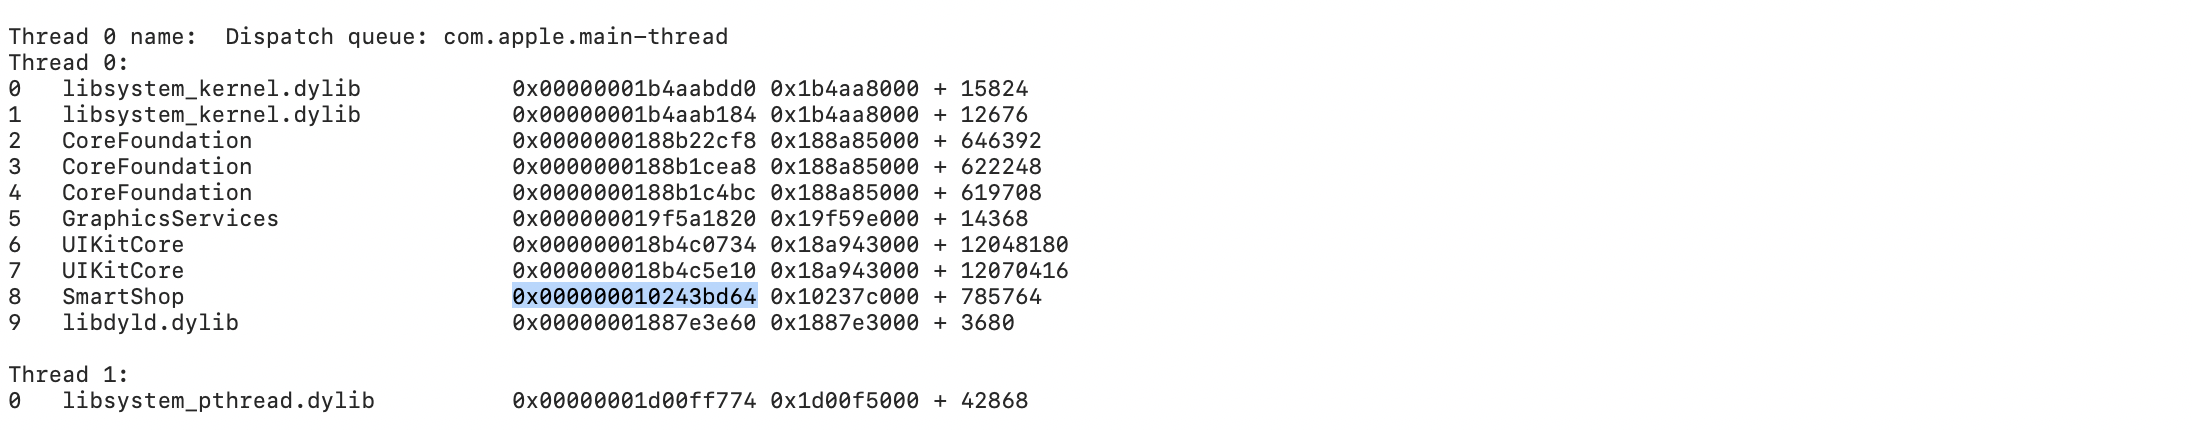
The article's sample command looks like this:
atos -arch arm64 -o <dSYM file path> -l 0x10237c000 0x000000010243bd64If the dSYM and addresses line up, the output should resolve the anonymous address back to the symbol that actually crashed.
The post was later updated with a short note that iOS 15 and later also introduced newer crash-analysis tooling.
That note is worth keeping in mind if you are reading this in a newer environment: the workflow here is still useful, but it is also a picture of the older archive-and-dSYM-heavy path that many teams still rely on for manual investigation.
The essential habit is to treat crash handling as a reproducible pipeline: collect the right report, match the right symbols, then decode with the simplest tool that fits the situation.
Xcode is easiest when you still have the device and archive close at hand. The device's Analytics Data view helps when the report must be pulled after the fact.
symbolicatecrash handles full reports, and atos is useful for targeted manual lookups.