The strength of this article is that it teaches memory leaks through one small, inspectable bug instead of abstract ARC theory.
The sample app ranks cats by how naughty they are. The UI is intentionally simple: a table view, a custom cell, and two buttons that move a cat up or down in the list. That small surface area makes the bug easy to reason about when the memory graph starts behaving incorrectly.
The sample is a custom UITableViewCell that talks back to its parent list controller.
This article links to the sample project here:
mszopensource/MemoryLeakTesting.
In the buggy version, cellForRowAt stores the parent controller inside
every cell so the up and down buttons can call back into the table logic.
override func tableView(
    _ tableView: UITableView,
    cellForRowAt indexPath: IndexPath
) -> UITableViewCell {
    let cell = tableView.dequeueReusableCell(withIdentifier: "naughtyCell") as! naughtyCell
    let catName = myCats[indexPath.row]
    cell.catNameLabel.text = catName
    cell.catTableView = self
    cell.catID = indexPath.row
    return cell
}
class naughtyCell: UITableViewCell {
@IBOutlet weak var catNameLabel: UILabel!
@IBAction func actionMoveUp() {
catTableView.moveCatUp(forCatNumber: catID)
}
@IBAction func actionMoveDown() {
catTableView.moveCatDown(forCatNumber: catID)
}
var catTableView: catList!
var catID: Int!
}
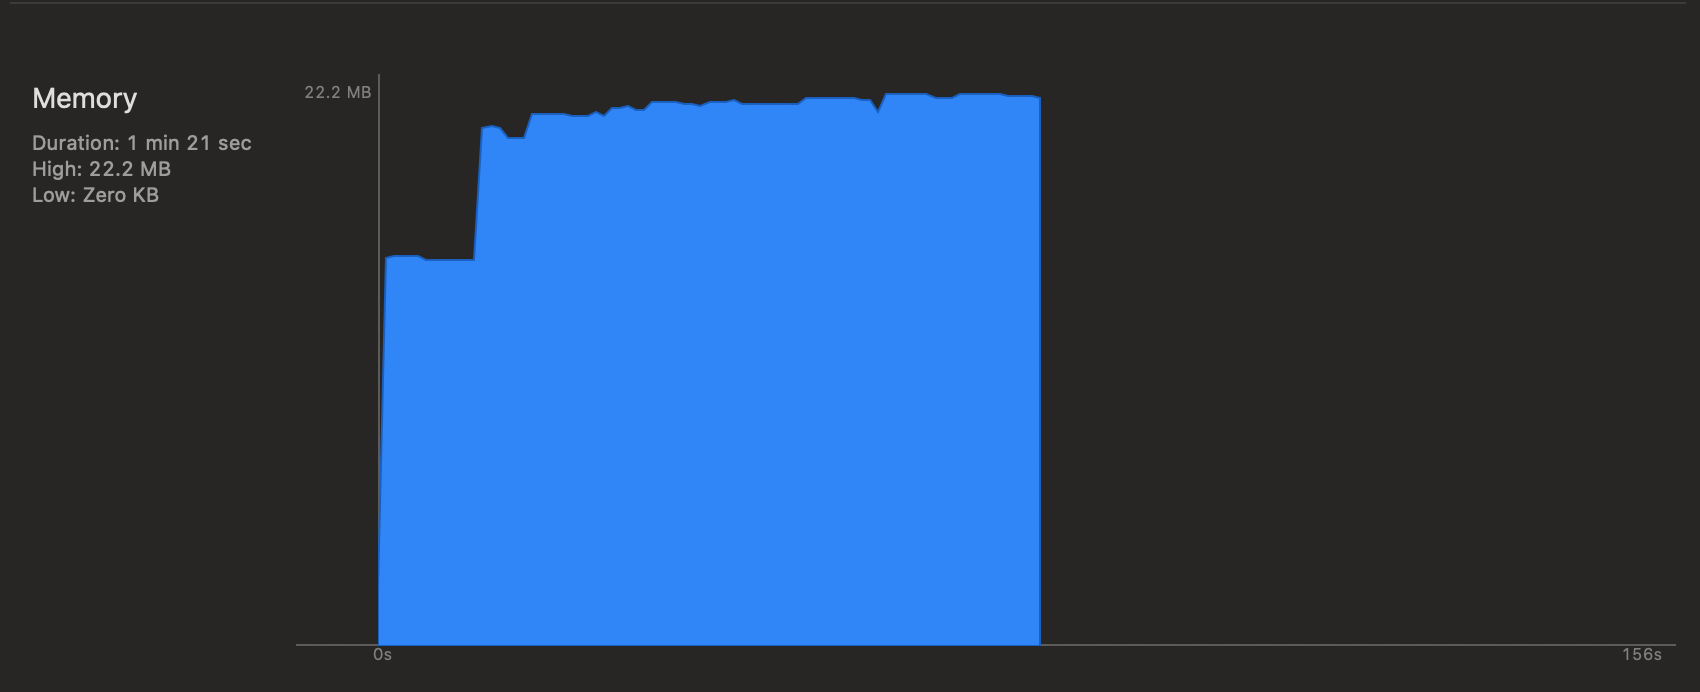
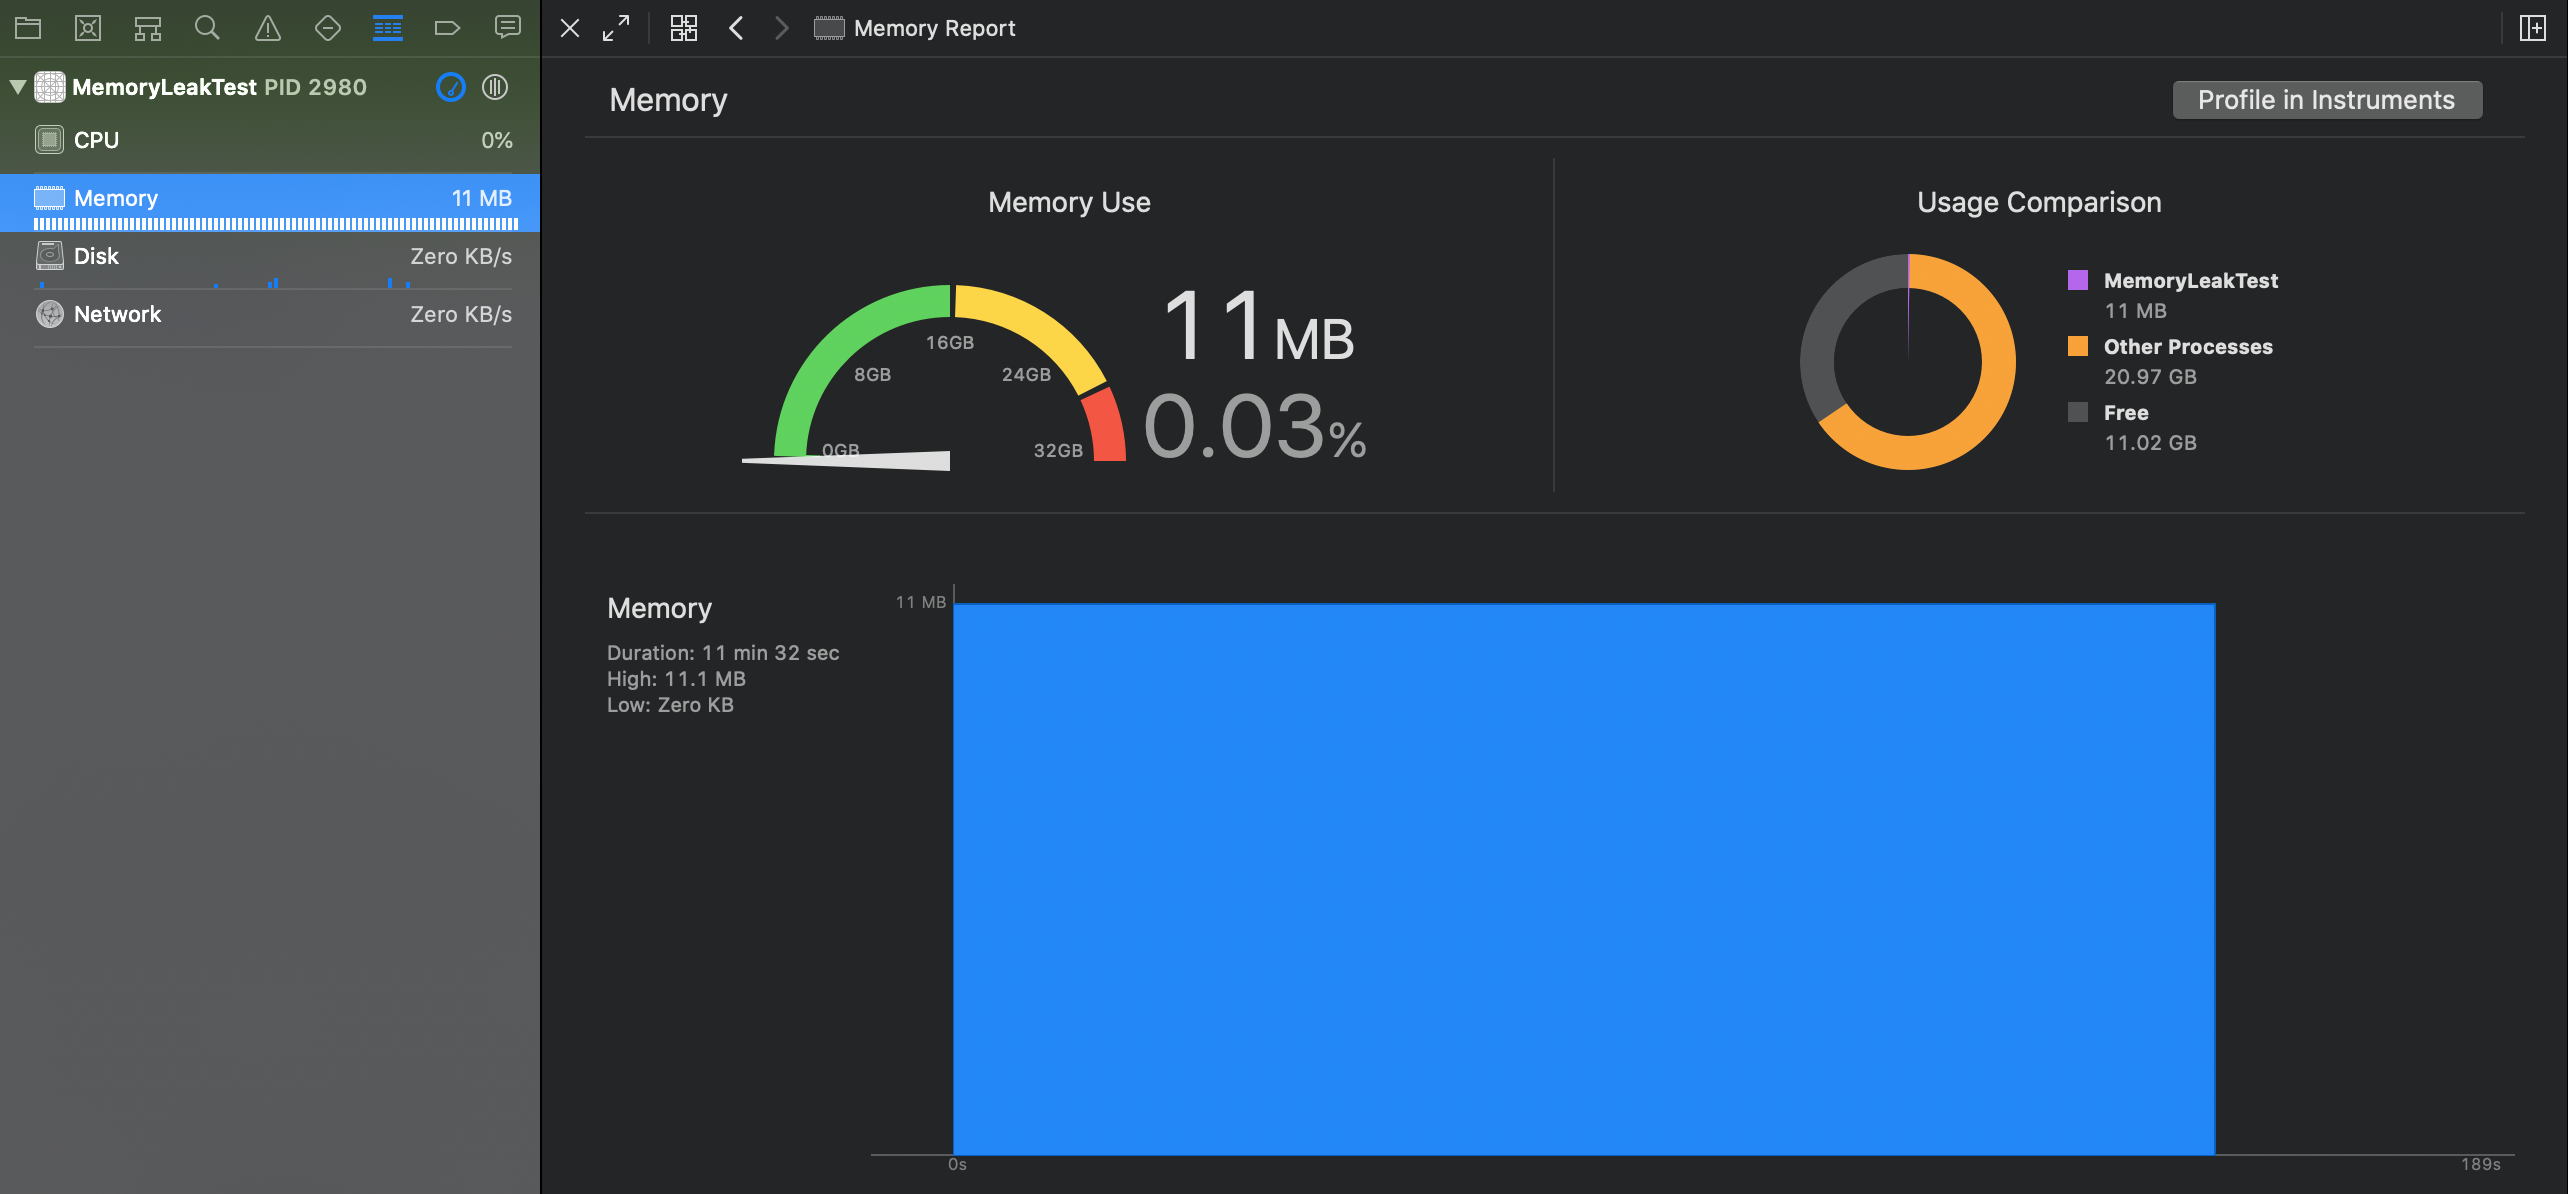
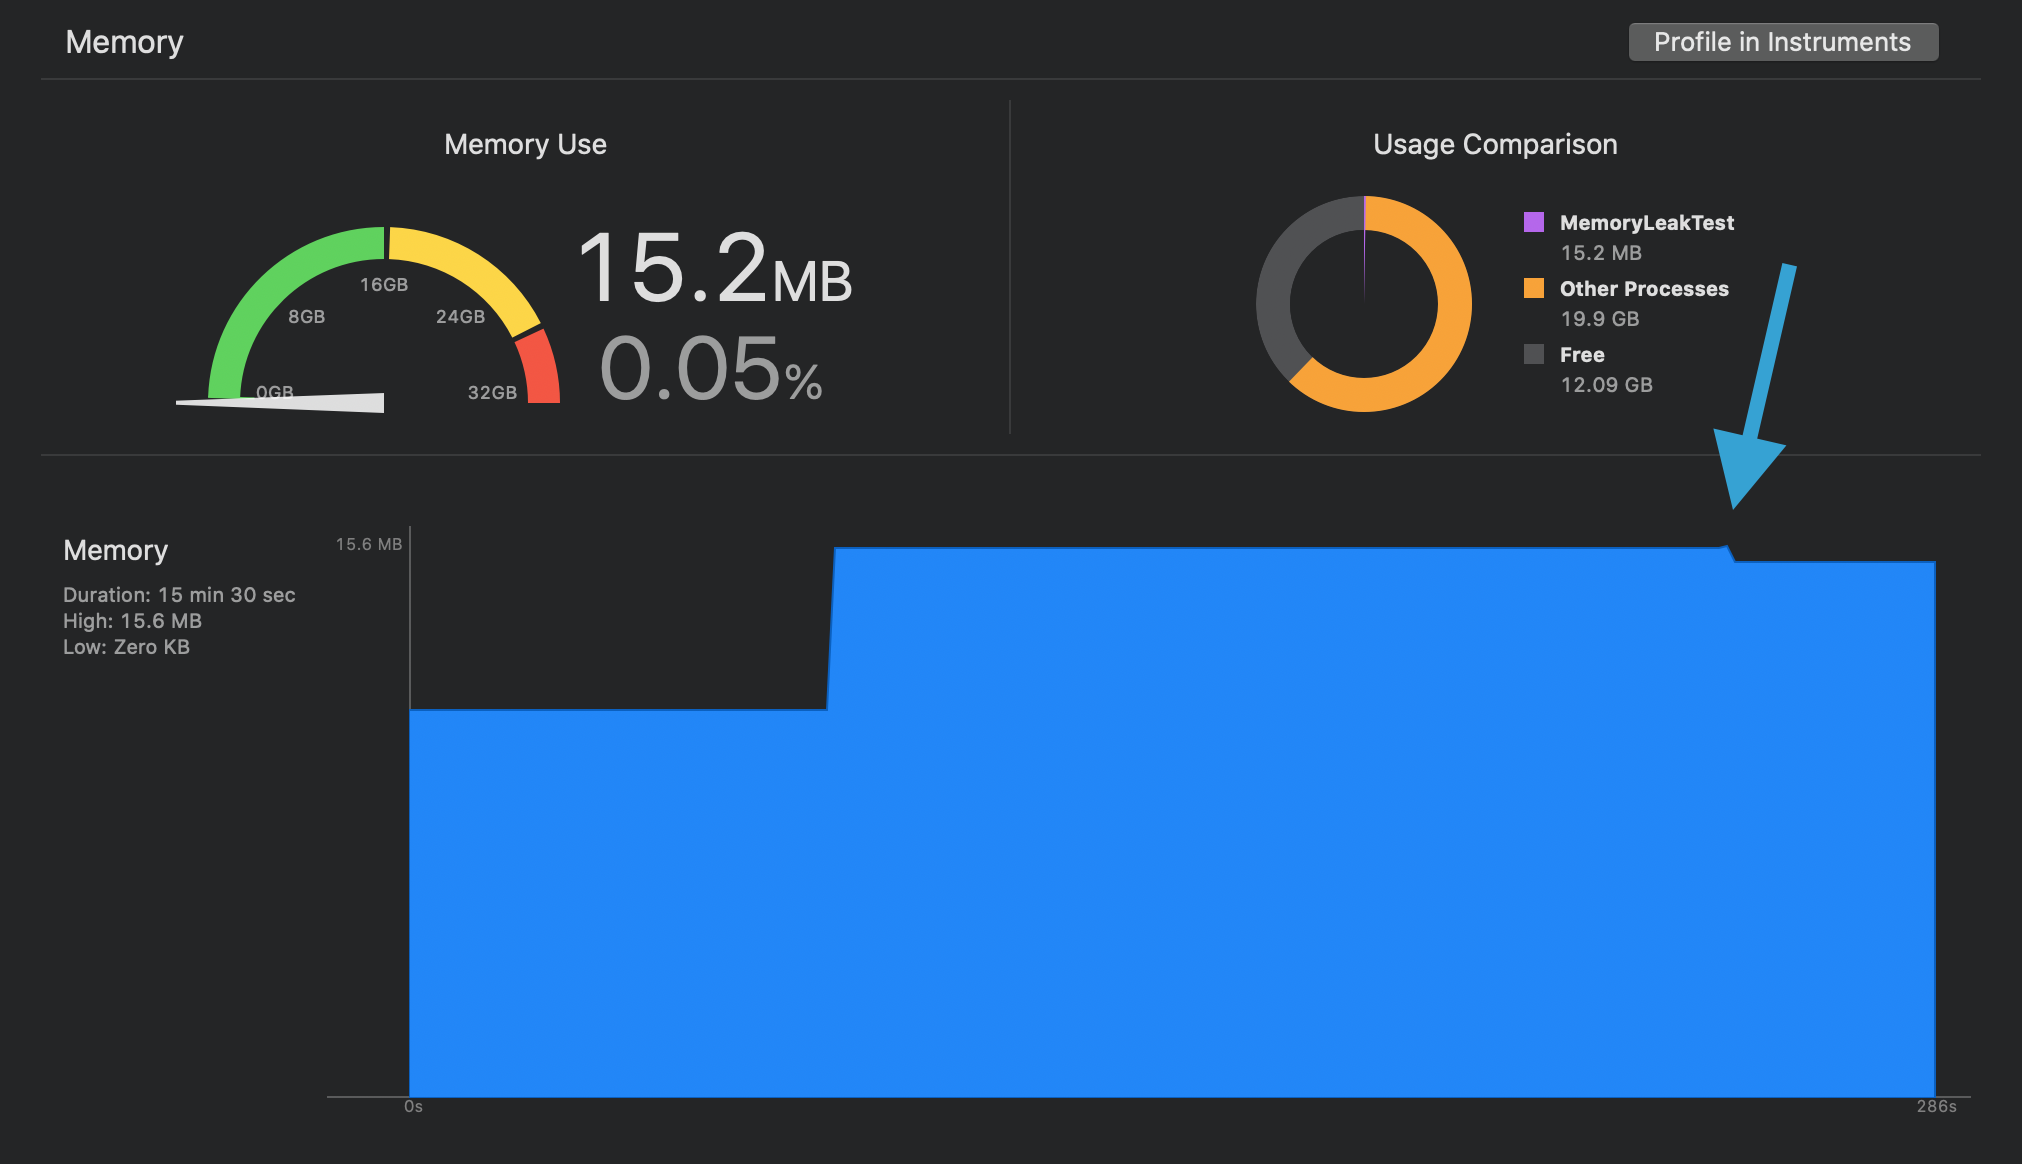
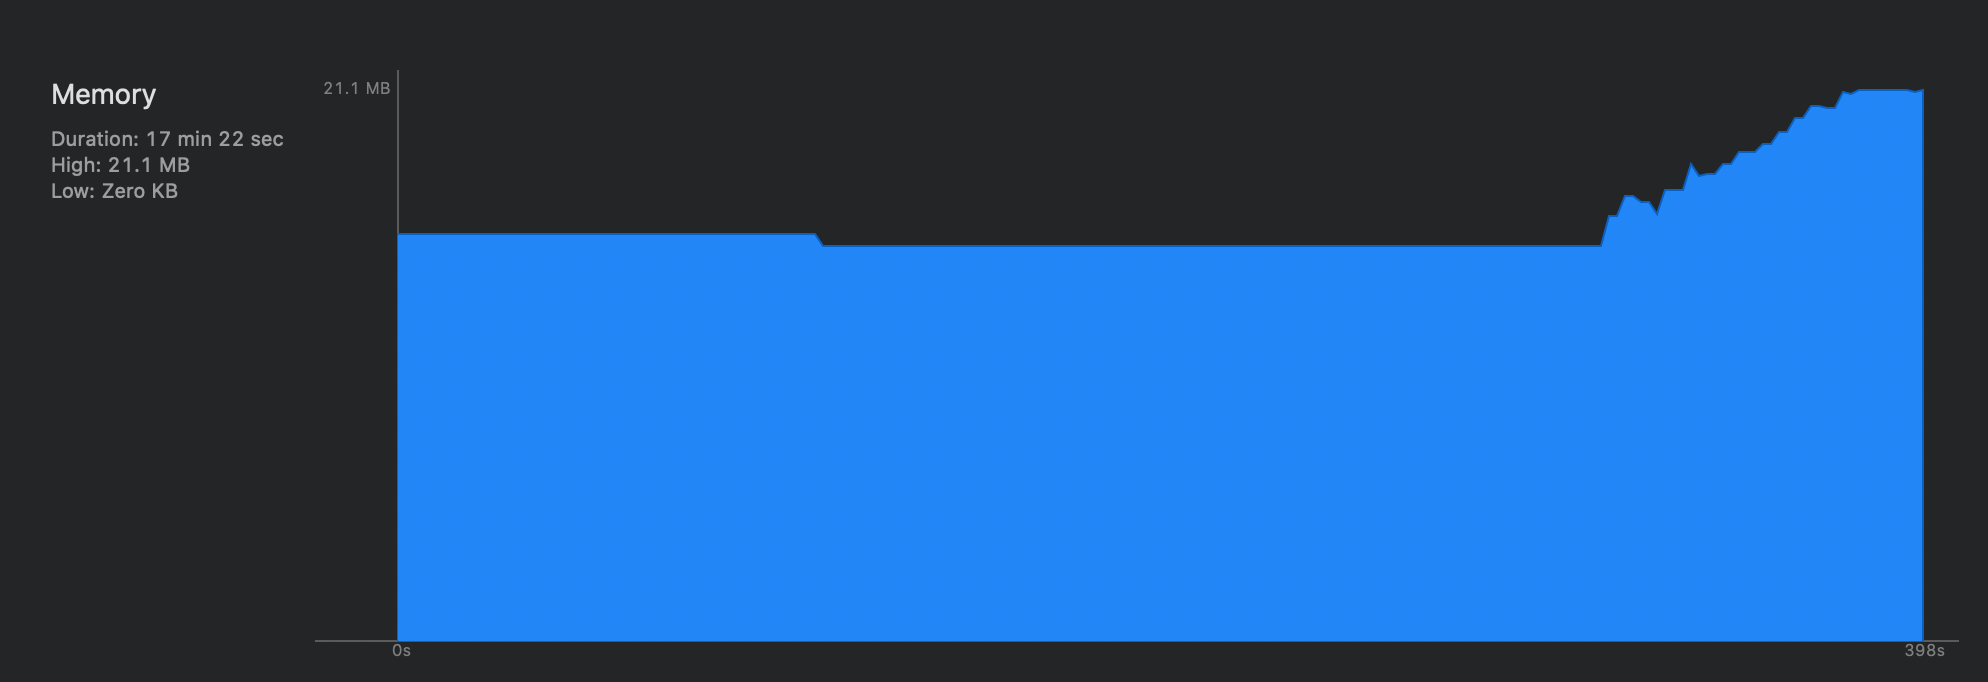
Start with the normal memory graph, then look for one suspicious pattern: memory rises on presentation and does not properly fall after dismissal.
The article first uses the standard Xcode debug navigator and the Memory
section at the bottom. Before doing anything, the graph stays flat. Opening the next
view controller raises the graph, which is expected. The warning sign appears after
closing that controller: the graph drops only a little instead of returning near the
earlier baseline.
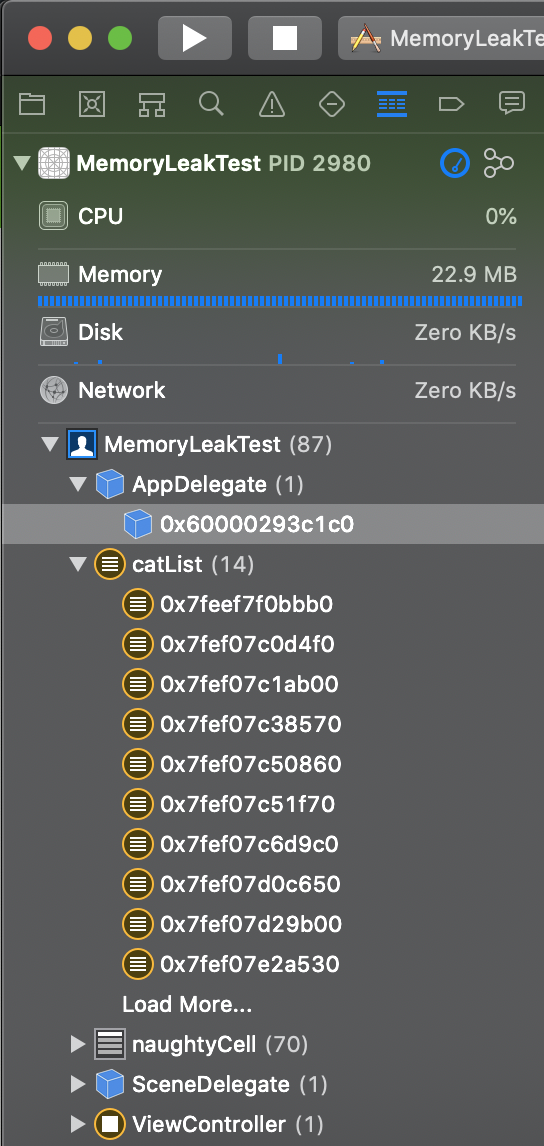
Use the memory graph debugger to confirm that the controllers and cells are still alive when they should have been released.
The second half of the investigation moves to the dedicated memory graph debugger.
Click the memory-graph button, let Xcode pause the app, and inspect the objects that
remain in memory. In this article, multiple catList controllers
and a large pile of naughtyCell instances are still retained.

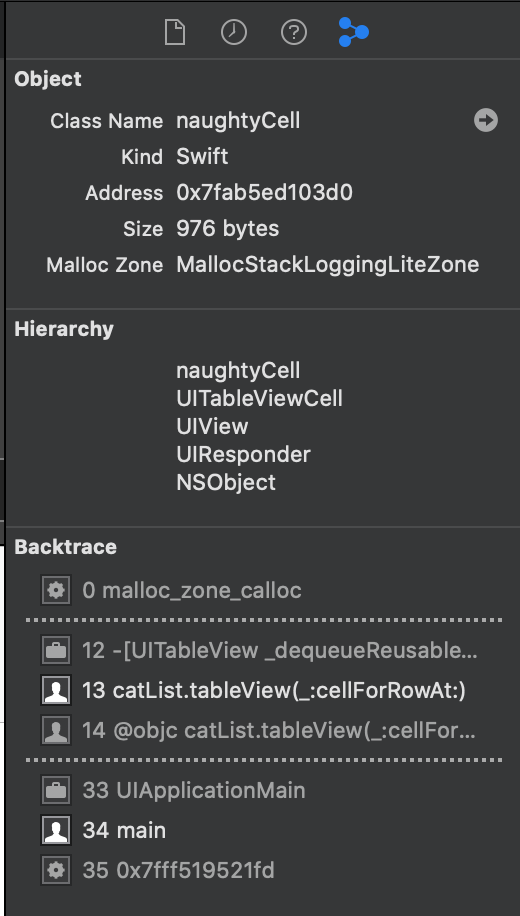
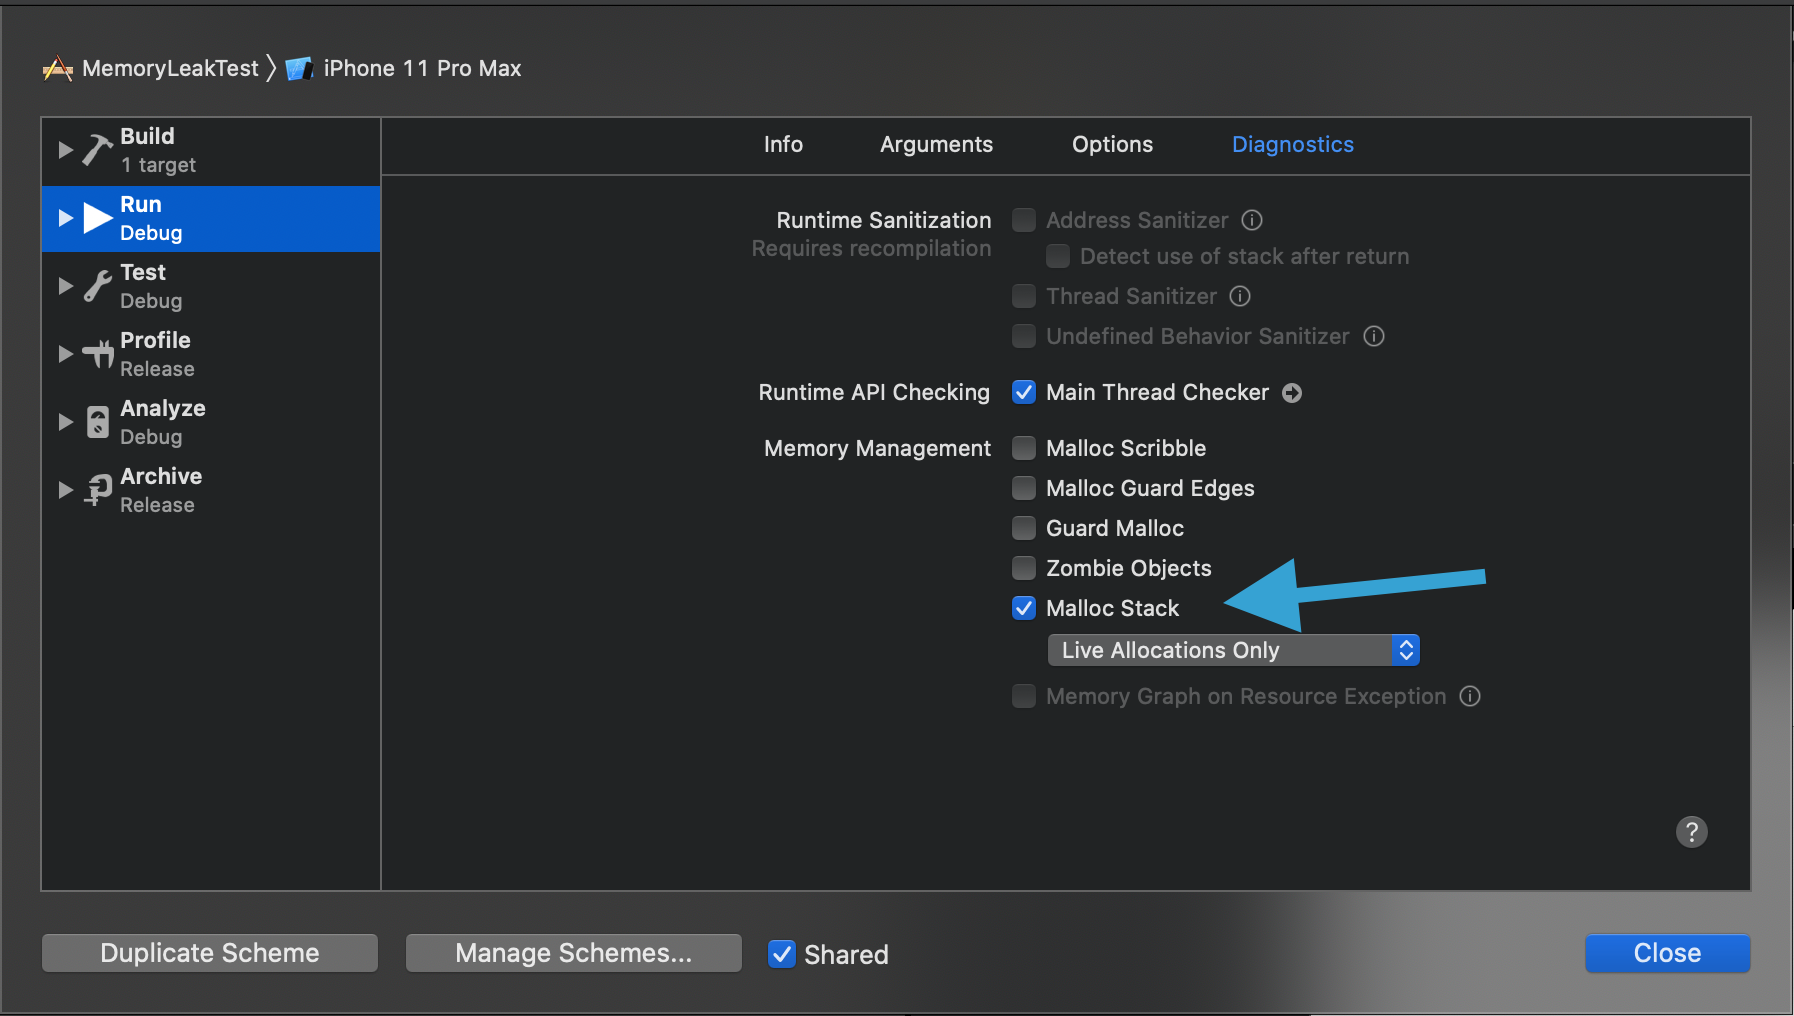
If the retained objects alone are not enough, turn on Malloc Stack logging in the scheme diagnostics and rerun the same actions.
This article highlights one especially useful step: go into the run scheme,
open the diagnostics tab, and enable Malloc Stack. Then repeat the same
open-close cycle, re-open the memory graph debugger, and inspect one of the retained
cells again.
The leak is a classic strong-reference cycle: the cell keeps the controller, and the controller keeps the table and its cells alive.
The article reduces the bug to two lines. The cell stores the controller strongly:
var catTableView: catList!And the controller assigns itself into each cell:
cell.catTableView = selfOnce that happens, ARC can no longer tear the screen down cleanly. The table view keeps its cells, and the cell points back toward the controller that owns the table view. The retained graph never fully collapses after dismissal.

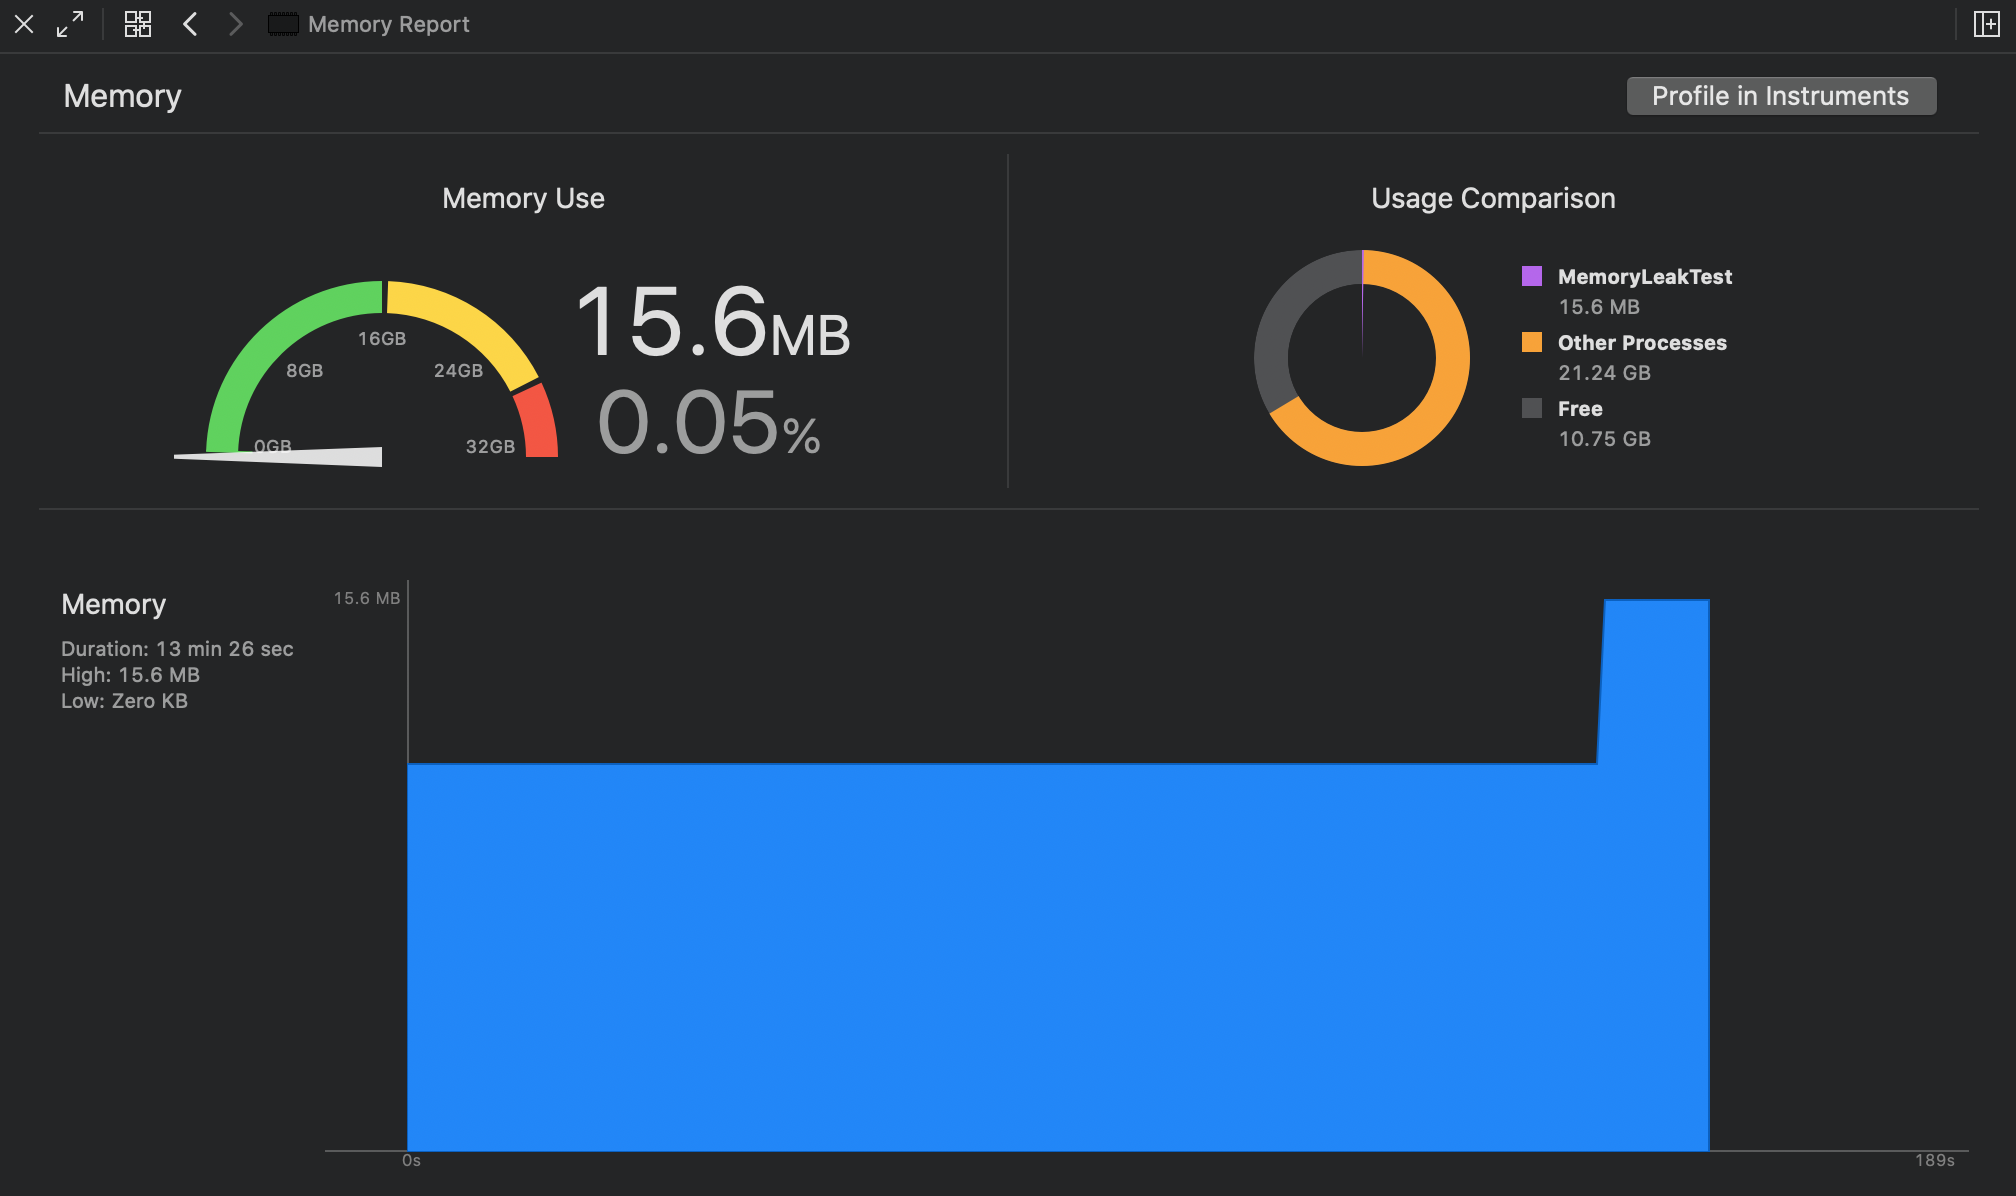
Replace the controller property with a weak delegate so the cell can send actions upward without owning the controller.
The fix in this article is not to remove communication. It is to change the communication shape. Instead of storing the controller directly, the cell talks to a protocol-backed delegate, and that delegate reference is weak.
protocol catListActionDelegate: AnyObject {
    func moveCatUp(forCatNumber: Int)
    func moveCatDown(forCatNumber: Int)
}
class naughtyCell: UITableViewCell {
weak var delegate: catListActionDelegate?
var catID: Int!
@IBAction func actionMoveUp() {
delegate?.moveCatUp(forCatNumber: catID)
}
@IBAction func actionMoveDown() {
delegate?.moveCatDown(forCatNumber: catID)
}
}class fixedCatList: UITableViewController, catListActionDelegateThe final proof is back in the memory graph. After the change, the graph no longer climbs in the same pathological way when the view controller is opened and closed repeatedly.