print is easy, but structured logging is what you want when messages should stay searchable and organized outside one debug session.
That is the main point of this article. Plain console output is useful while you are staring at Xcode, but it does not give you the same level of categorization, persistence, or privacy control as Apple's logging framework.
The iOS 14-era Logger API made this more ergonomic in Swift. You can emit structured messages,
split them by subsystem and category, and choose whether interpolated values should remain visible or be treated as private.
Start by creating a logger with a distinct subsystem and category.
The article emphasizes this early because the names are not cosmetic. They are the keys you will later use to find your app's log stream inside Console.app.
let logger = Logger(subsystem: "com.example.OSLogExample",
                    category: "OSLogExample")
Use names that are stable and searchable. A subsystem usually maps naturally to your bundle-style identifier, and a category can represent one area of the app, one feature, or one diagnostics channel.
The article's real value is in combining severity levels with explicit privacy markers.
The example keeps two pieces of text around: one intended to remain visible and one intended to be hidden when logs leave the safest development path.
@State var publicLogContent: String = "Public log content"
@State var privateLogContent: String = "Private log content"
Those values are then interpolated into a series of log calls. The public field is emitted with privacy: .public,
while the private field is emitted with privacy: .private.
// .debug
logger.debug("This is a debug log: \(self.publicLogContent, privacy: .public) \(self.privateLogContent, privacy: .private)")
// general log message
logger.log("This is an informational log: \(self.publicLogContent, privacy: .public) \(self.privateLogContent, privacy: .private)")
// .notice
logger.notice("This is a notice log: \(self.publicLogContent, privacy: .public) \(self.privateLogContent, privacy: .private)")
// .error
logger.error("This is an error log: \(self.publicLogContent, privacy: .public) \(self.privateLogContent, privacy: .private)")
// .fault
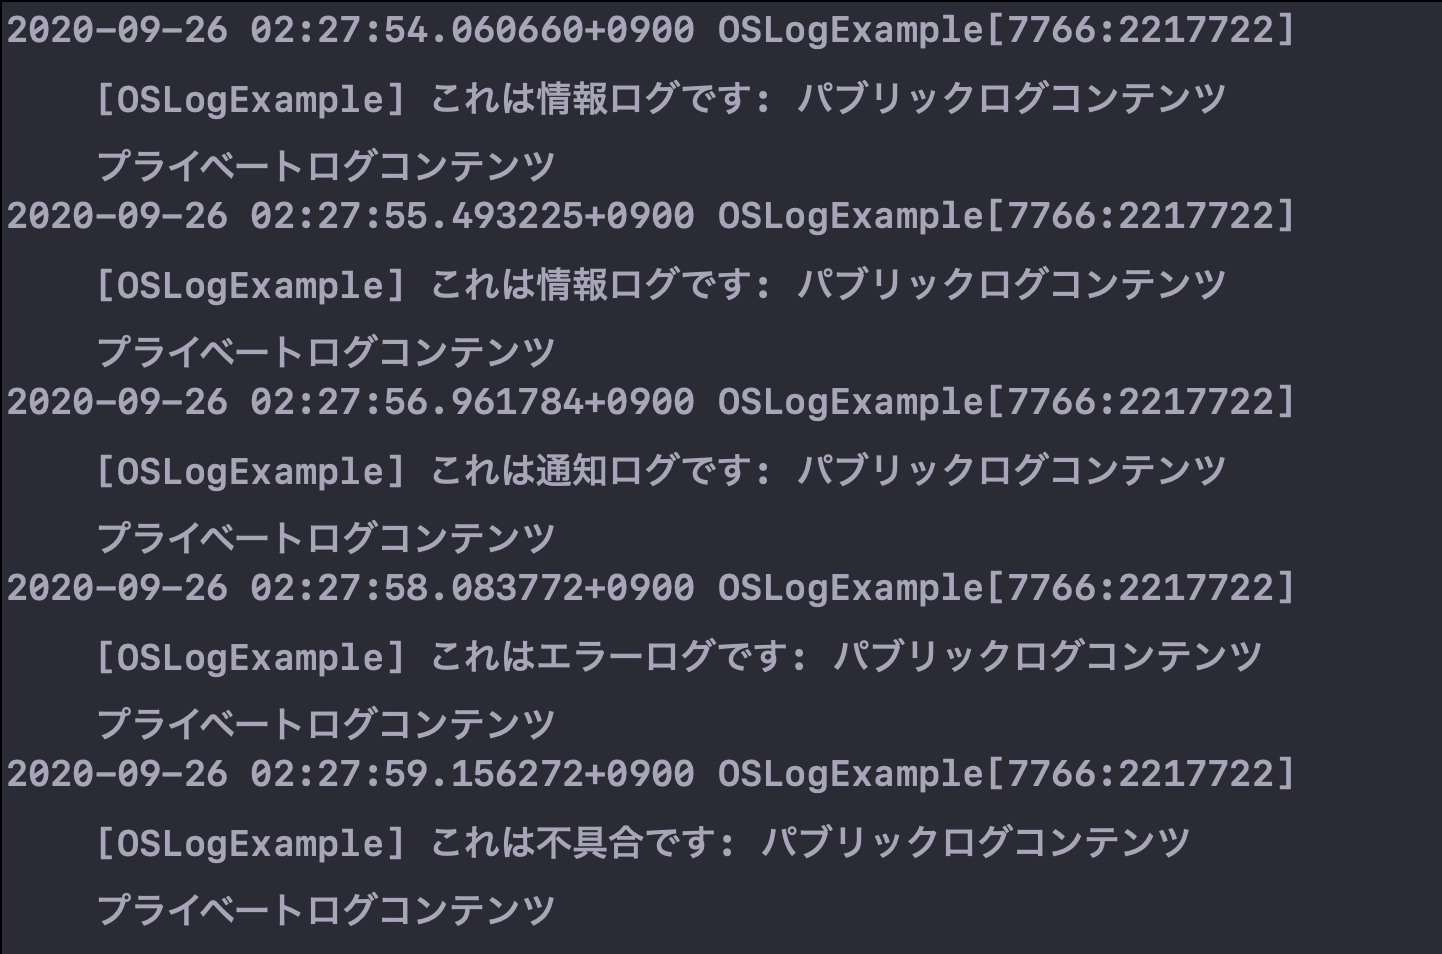
logger.fault("This is a fault log: \(self.publicLogContent, privacy: .public) \(self.privateLogContent, privacy: .private)")This article describes five message classes in practice: debug, general informational logging, notice, error, and fault. The key behavior difference is where those messages show up live and whether private content is still visible.
In the article's summary:
.debug is the ordinary development-time channel and is visible in Xcode but not live in Console the same way as the higher-severity classes.
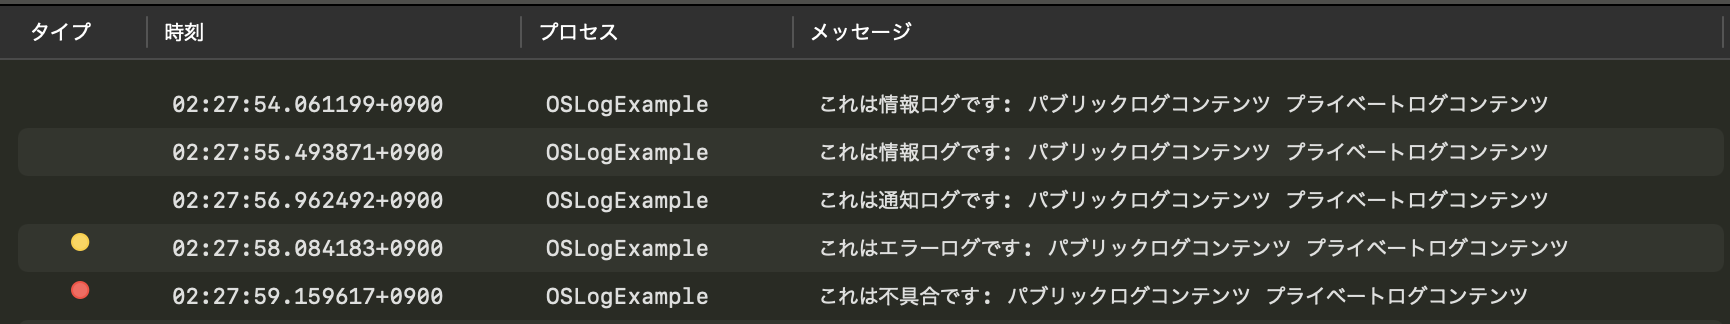
The general log, .notice, .error, and .fault are the messages you are more likely to inspect later in Console.app as well.
Xcode and Console.app do not expose the same view of your logs, especially once privacy rules enter the picture.
While the device is connected and the app is launched from Xcode, the log stream is easiest to watch directly inside Xcode's console. That is the most development-friendly path and the one where all message classes are immediately visible.
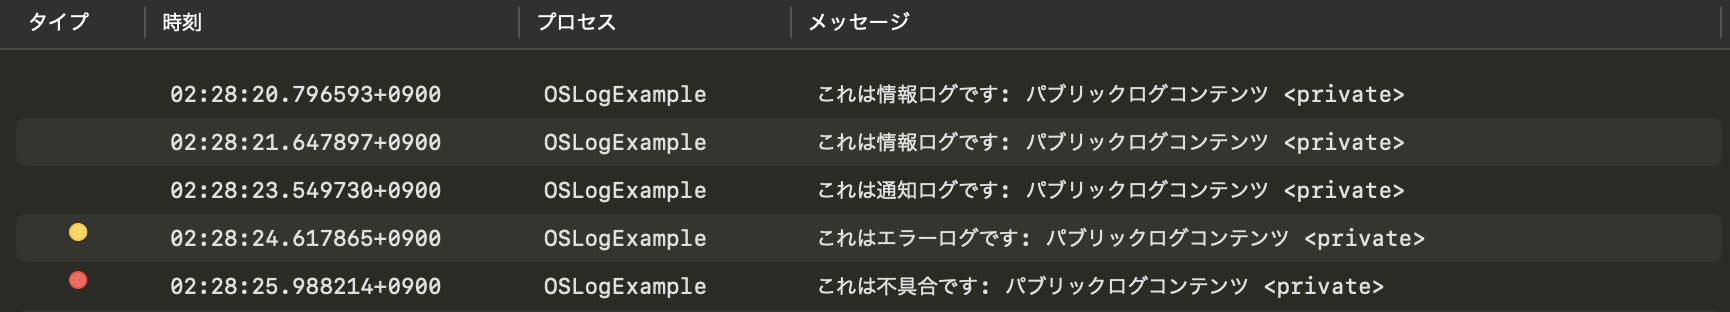
Once you move into Console.app, private content becomes the important distinction. This article calls out that private interpolated values are hidden there.
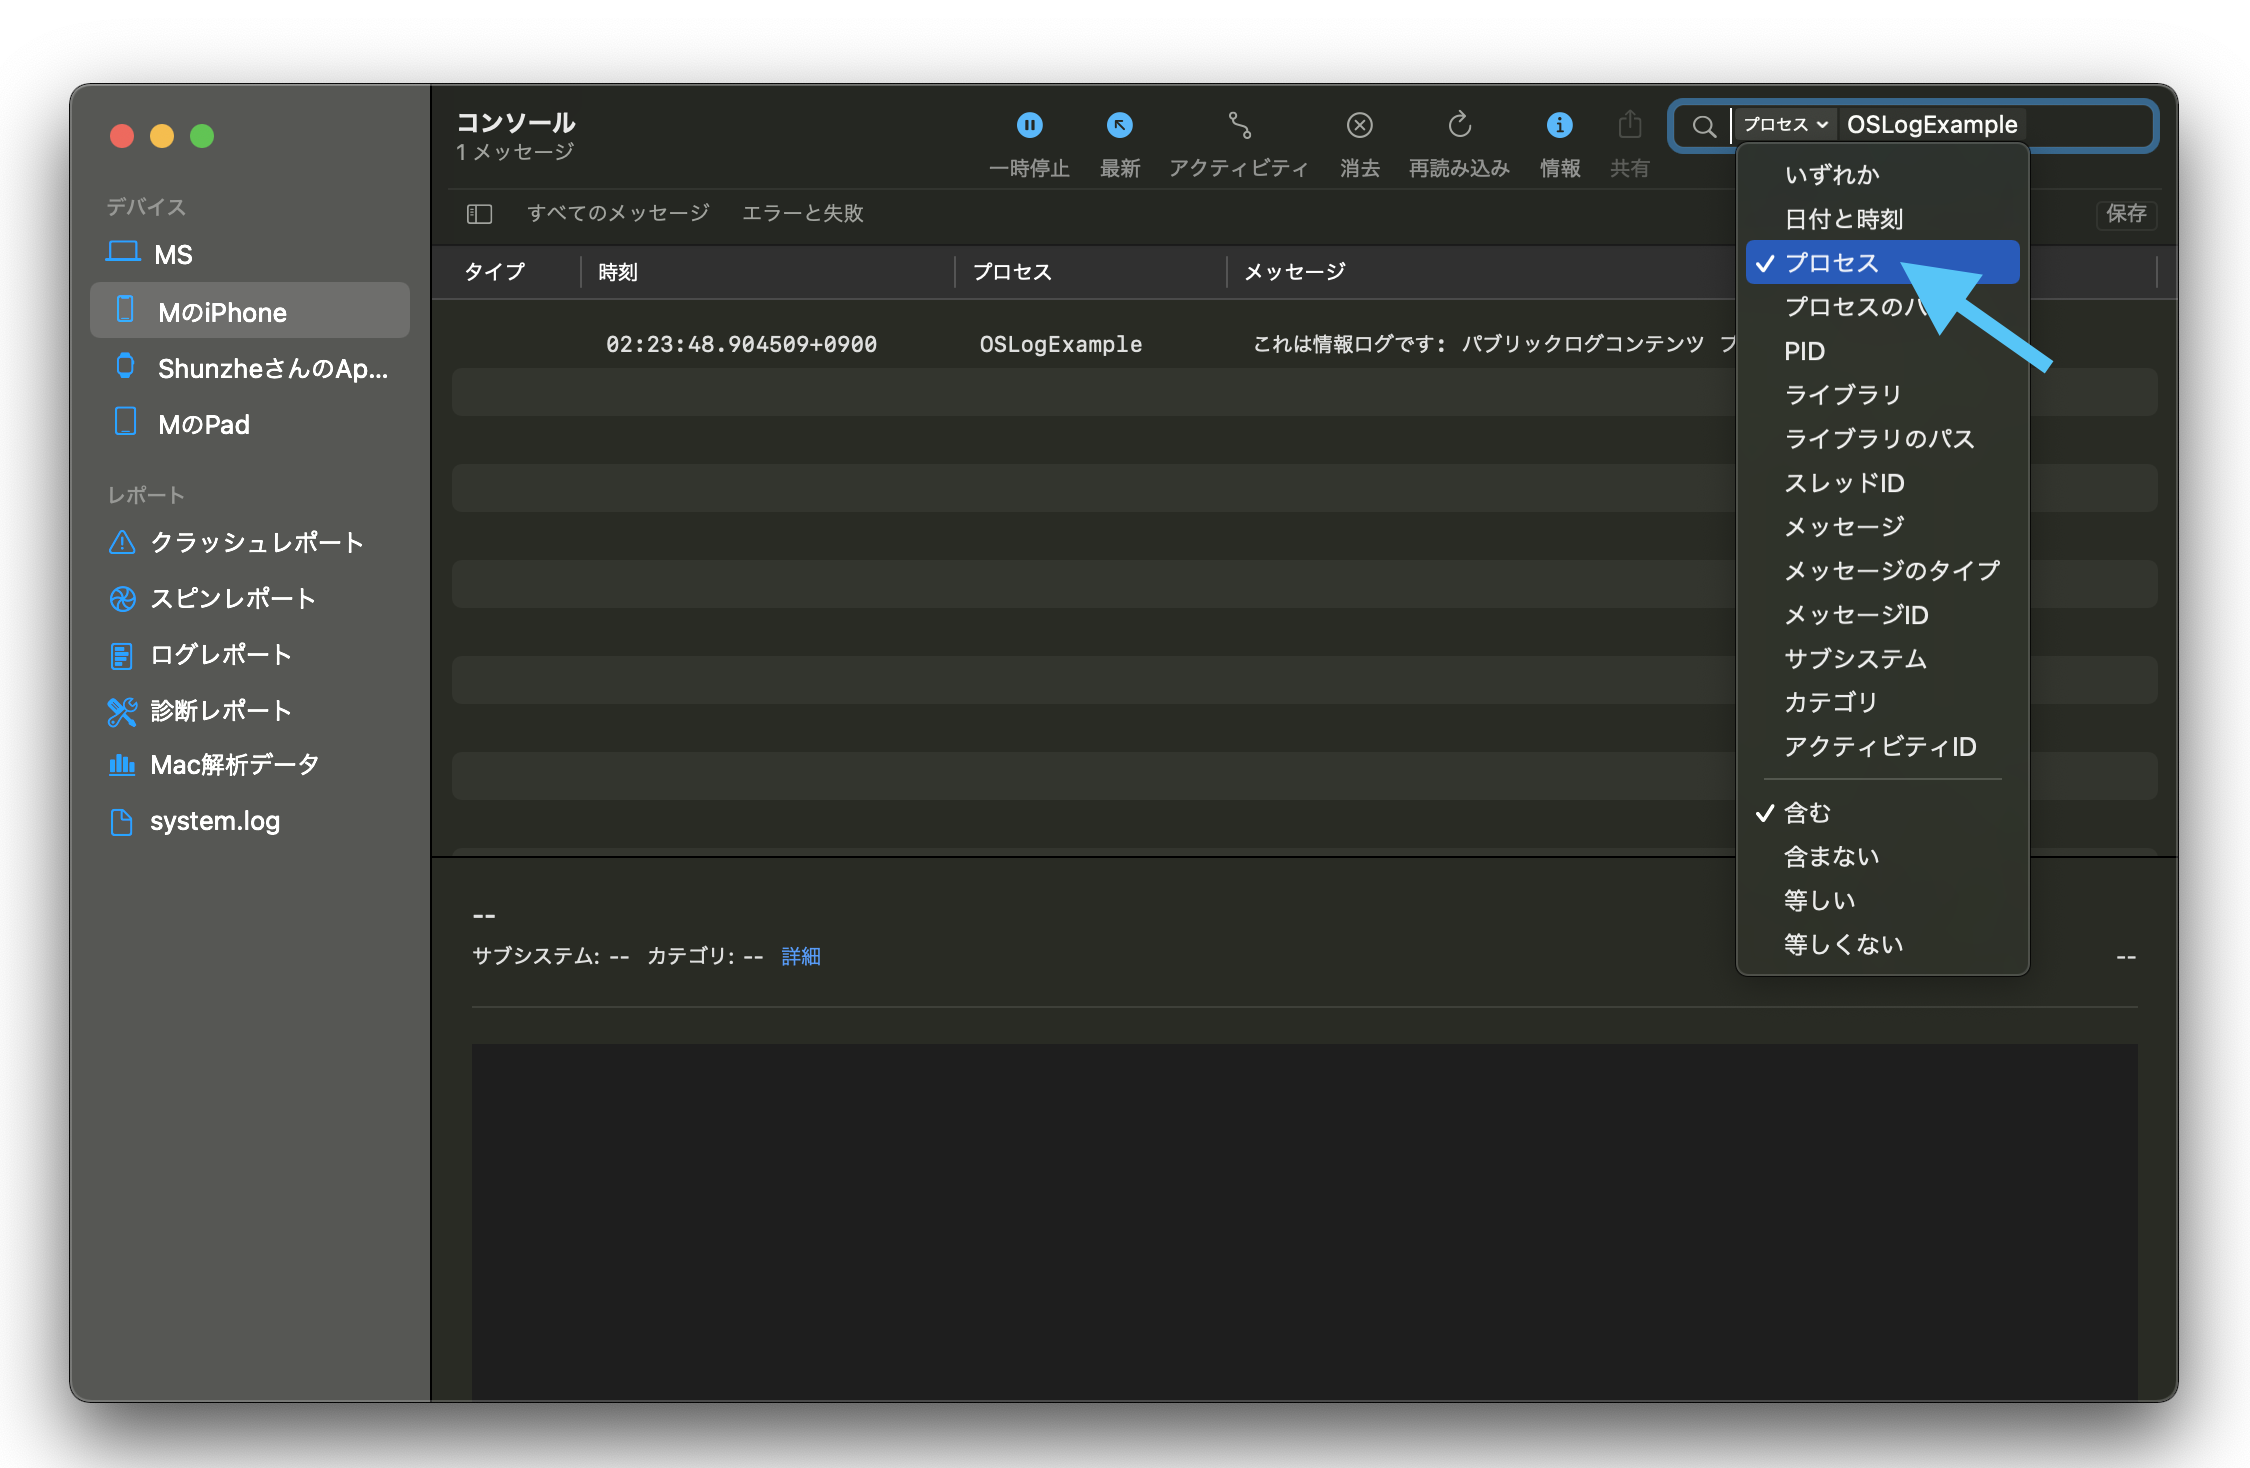
The most practical Console.app trick in the article is to search by your logger category and switch the filter mode to Process.
The workflow on macOS is simple: open Applications > Utilities > Console, select the connected iPhone,
then search for the category name you used when you created the logger. In the article's example that category is OSLogExample.
The post then points out one extra step that makes the results cleaner: use the small arrow control next to the search UI
and change the search condition to Process. That narrows the stream more effectively than a plain full-text search.
The main lesson is to stop treating logs as throwaway strings and start treating them as structured diagnostic events.
That means giving each logger a stable identity, choosing severity intentionally, marking sensitive values as private, and knowing which tool to use when reading the output back. Xcode is for immediate debugging. Console.app is for structured inspection on the Mac side.
Even though this post is from the iOS 14 transition period, the underlying habits are still the right ones.