This article is useful because it moves from the simplest debugging habit to the more structured Xcode tools without pretending every problem needs the same level of machinery.
Sometimes you only need a quick log. Sometimes you need the debugger to stop on the exact iteration that matters. And sometimes the crash has already escaped into production, so the only practical starting point is Organizer. This article keeps those layers separate so the workflow stays easy to reason about.
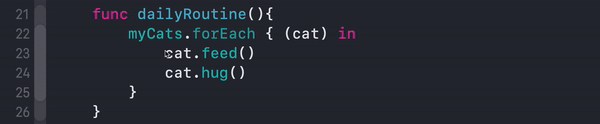
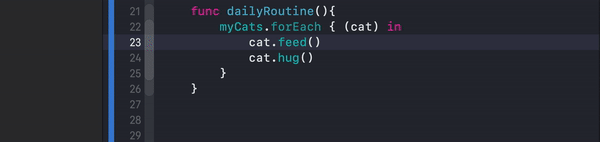
myCats and a simple loop over each cat, which makes the breakpoint and LLDB examples easy to follow.
Start with logging when the bug is still small enough that plain output can explain the control flow.
This article starts with the oldest debugging tool for a reason: it is still fast. If you only need to verify that a collection contains what you expect or that a loop is visiting the right values, a few temporary prints can be enough.
func dailyRoutine() {
    print(myCats)

    myCats.forEach { cat in
        print("Current cat: \(cat.name)")
        cat.feed()
        cat.hug()
    }
}
Logging is not elegant, but it is cheap. The tradeoff is that once you need to stop on one specific state instead of printing everything, breakpoints become a better tool.
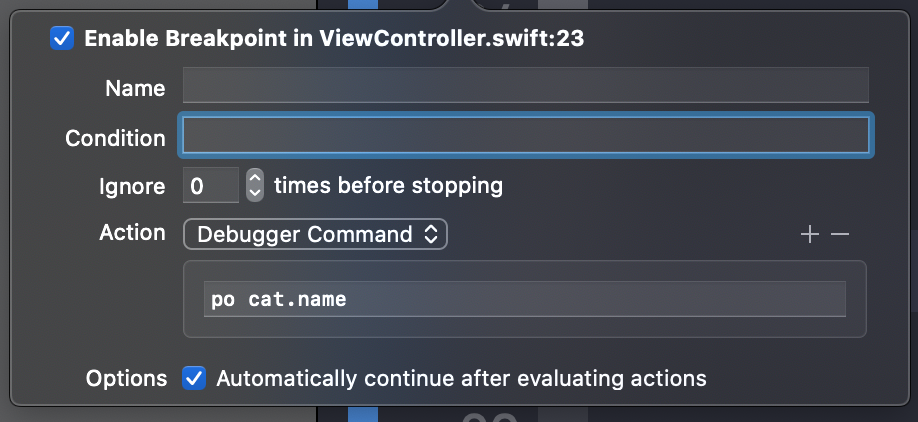
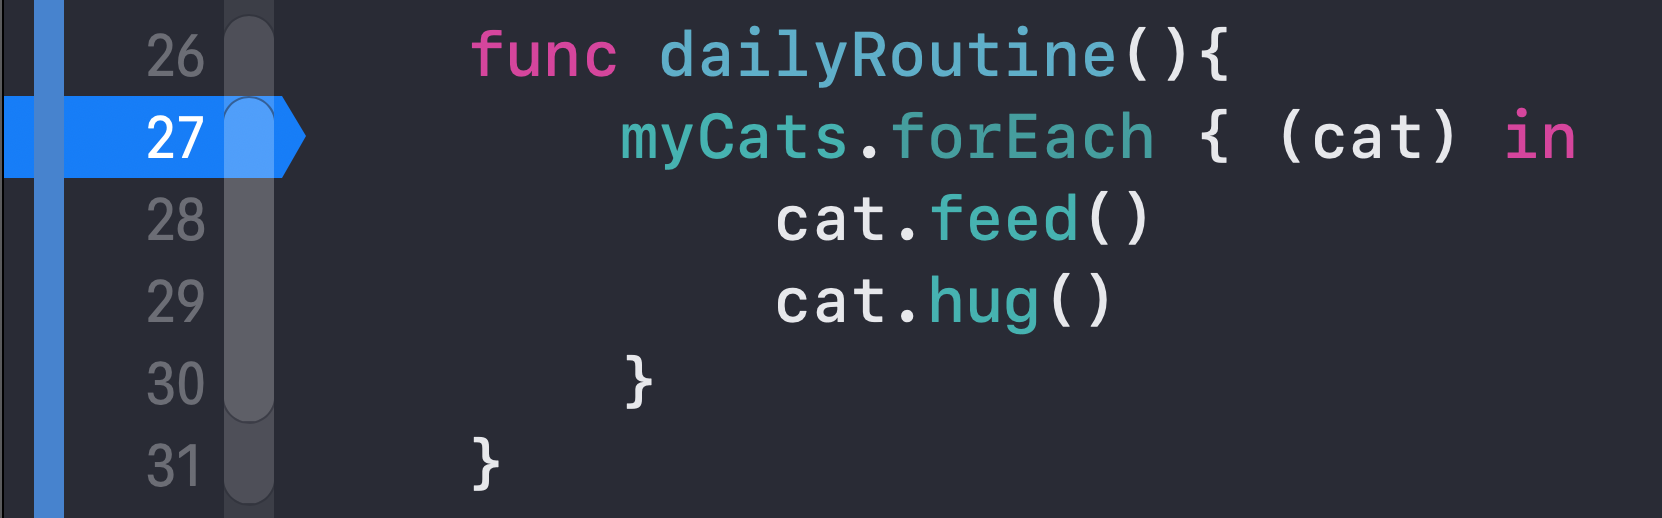
Regular breakpoints stop the program at one exact line, while conditional breakpoints wait until the state actually becomes interesting.
A normal breakpoint is just a stop marker on a line number. Run the app, let execution hit that line, and Xcode freezes the process so you can inspect the local state instead of inferring it from logs.
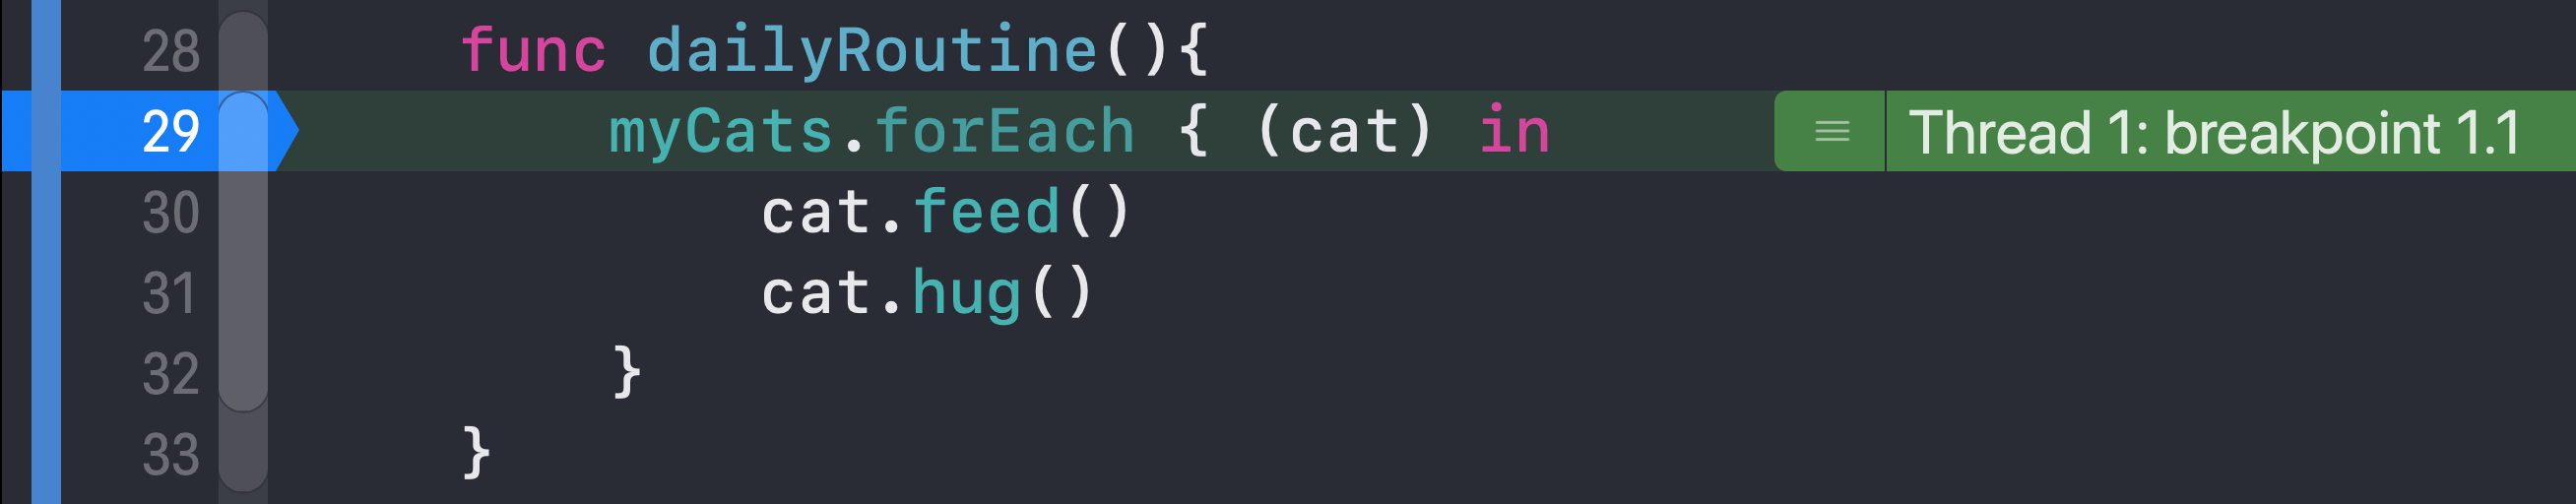
Conditional breakpoints are the next step up. Instead of stopping on every loop iteration, they stop only when a condition becomes true.
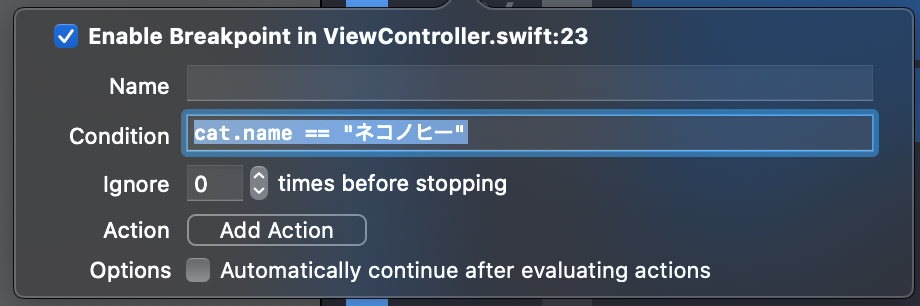
cat.name == "Nekonohi".Breakpoint actions let you log or evaluate expressions without stopping execution, which is often cleaner than scattering temporary print statements across the code.
This article uses this feature to turn a breakpoint into a structured trace point. You attach an
action such as po cat.name and tell Xcode to continue automatically after evaluation.
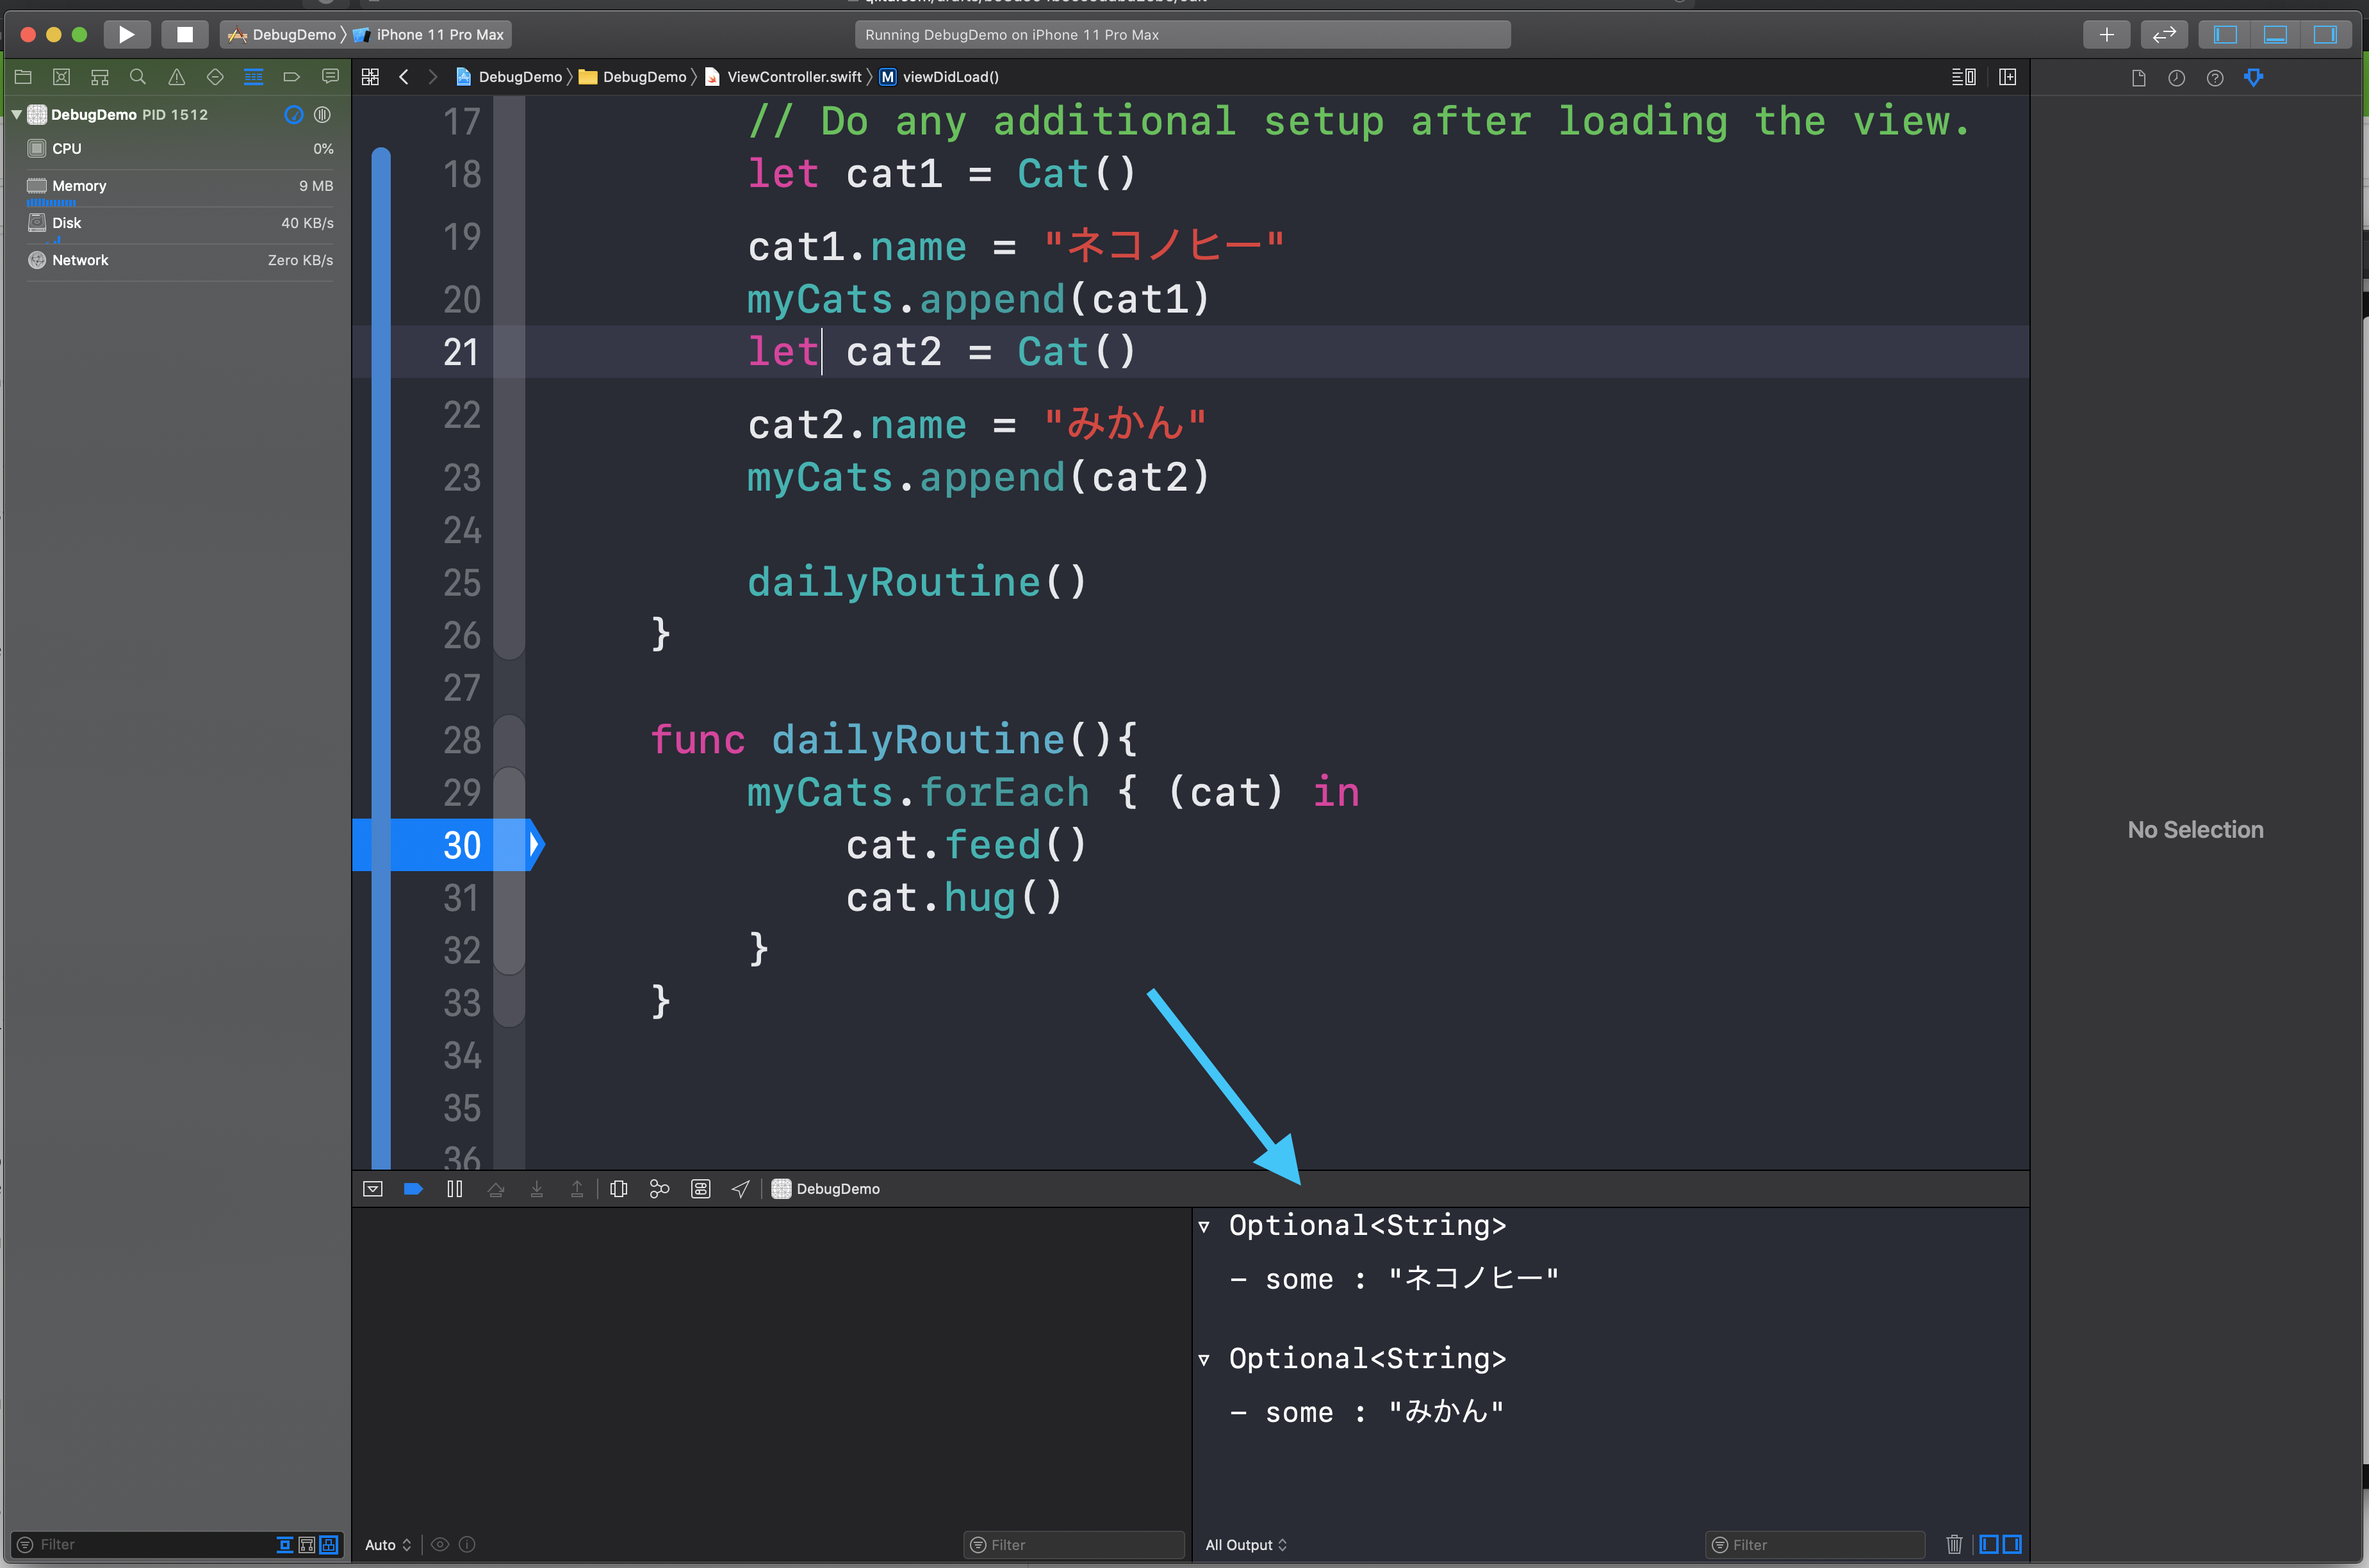
Once the process is paused, the built-in debugger console becomes the most flexible tool in the article: you can inspect values, derive new information, and even mutate state.
The post uses the po command, which prints the result of an expression from the current
runtime context. That makes it ideal for answering focused questions while paused at a breakpoint.
po myCats
po myCats.count
po myCats.first?.name
The article also points out that the debugger can mutate state. That is not a production fix, but it is a good way to test a theory instantly.
po myCats.count      // 2
po myCats.append(.init())
po myCats.count      // 3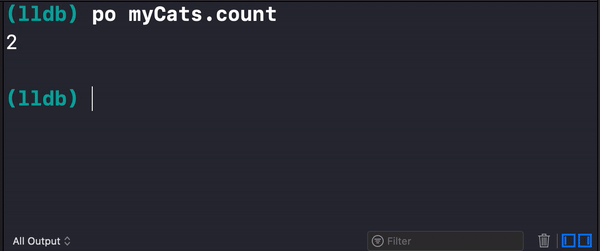
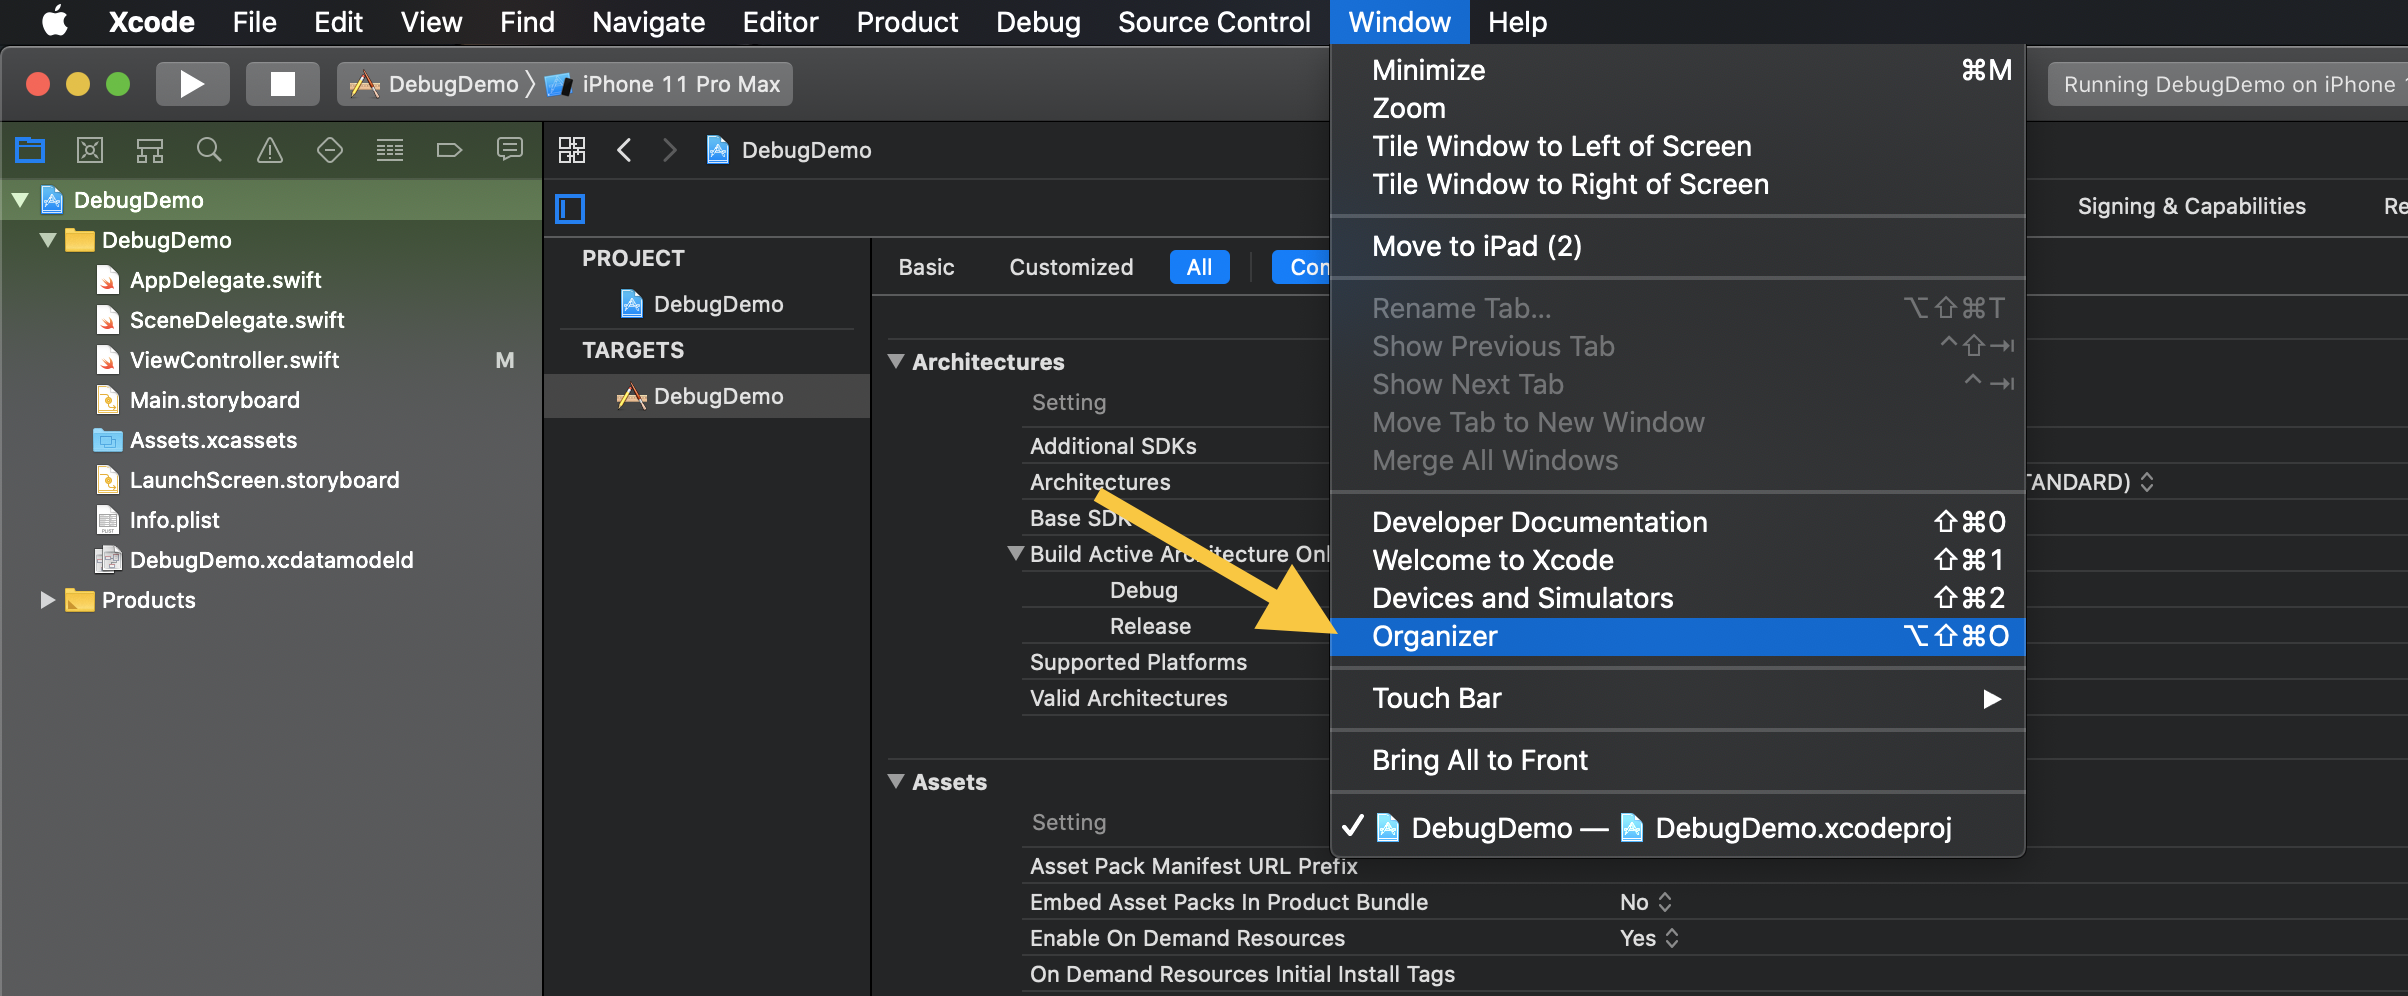
When the bug already escaped into a shipped build, Organizer becomes the article's production-side entry point for crash investigation.
If the app is already on the App Store, Apple can aggregate crash reports for you. The article walks
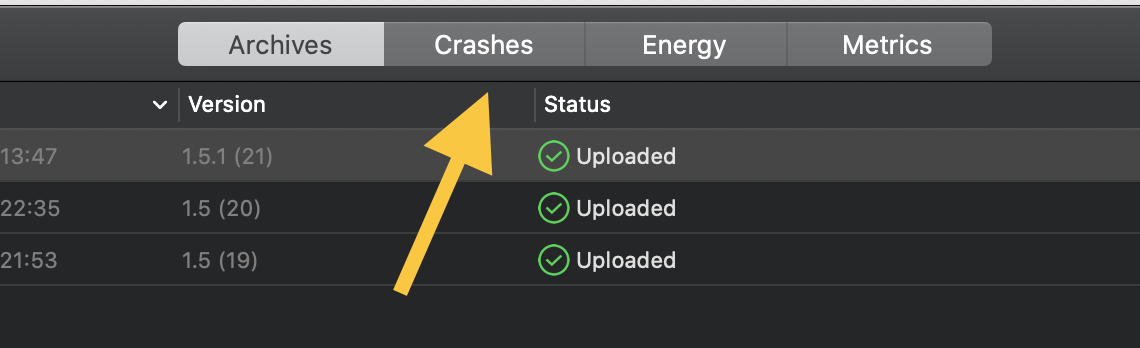
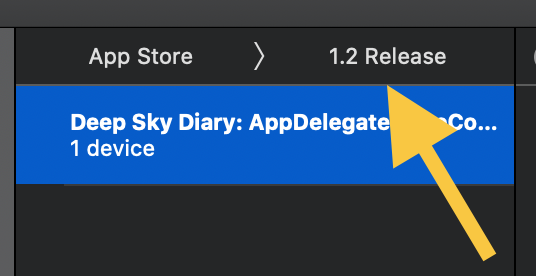
through the Organizer path: open Window > Organizer, choose the app, open the
Crashes section, pick a version, then inspect one concrete report.
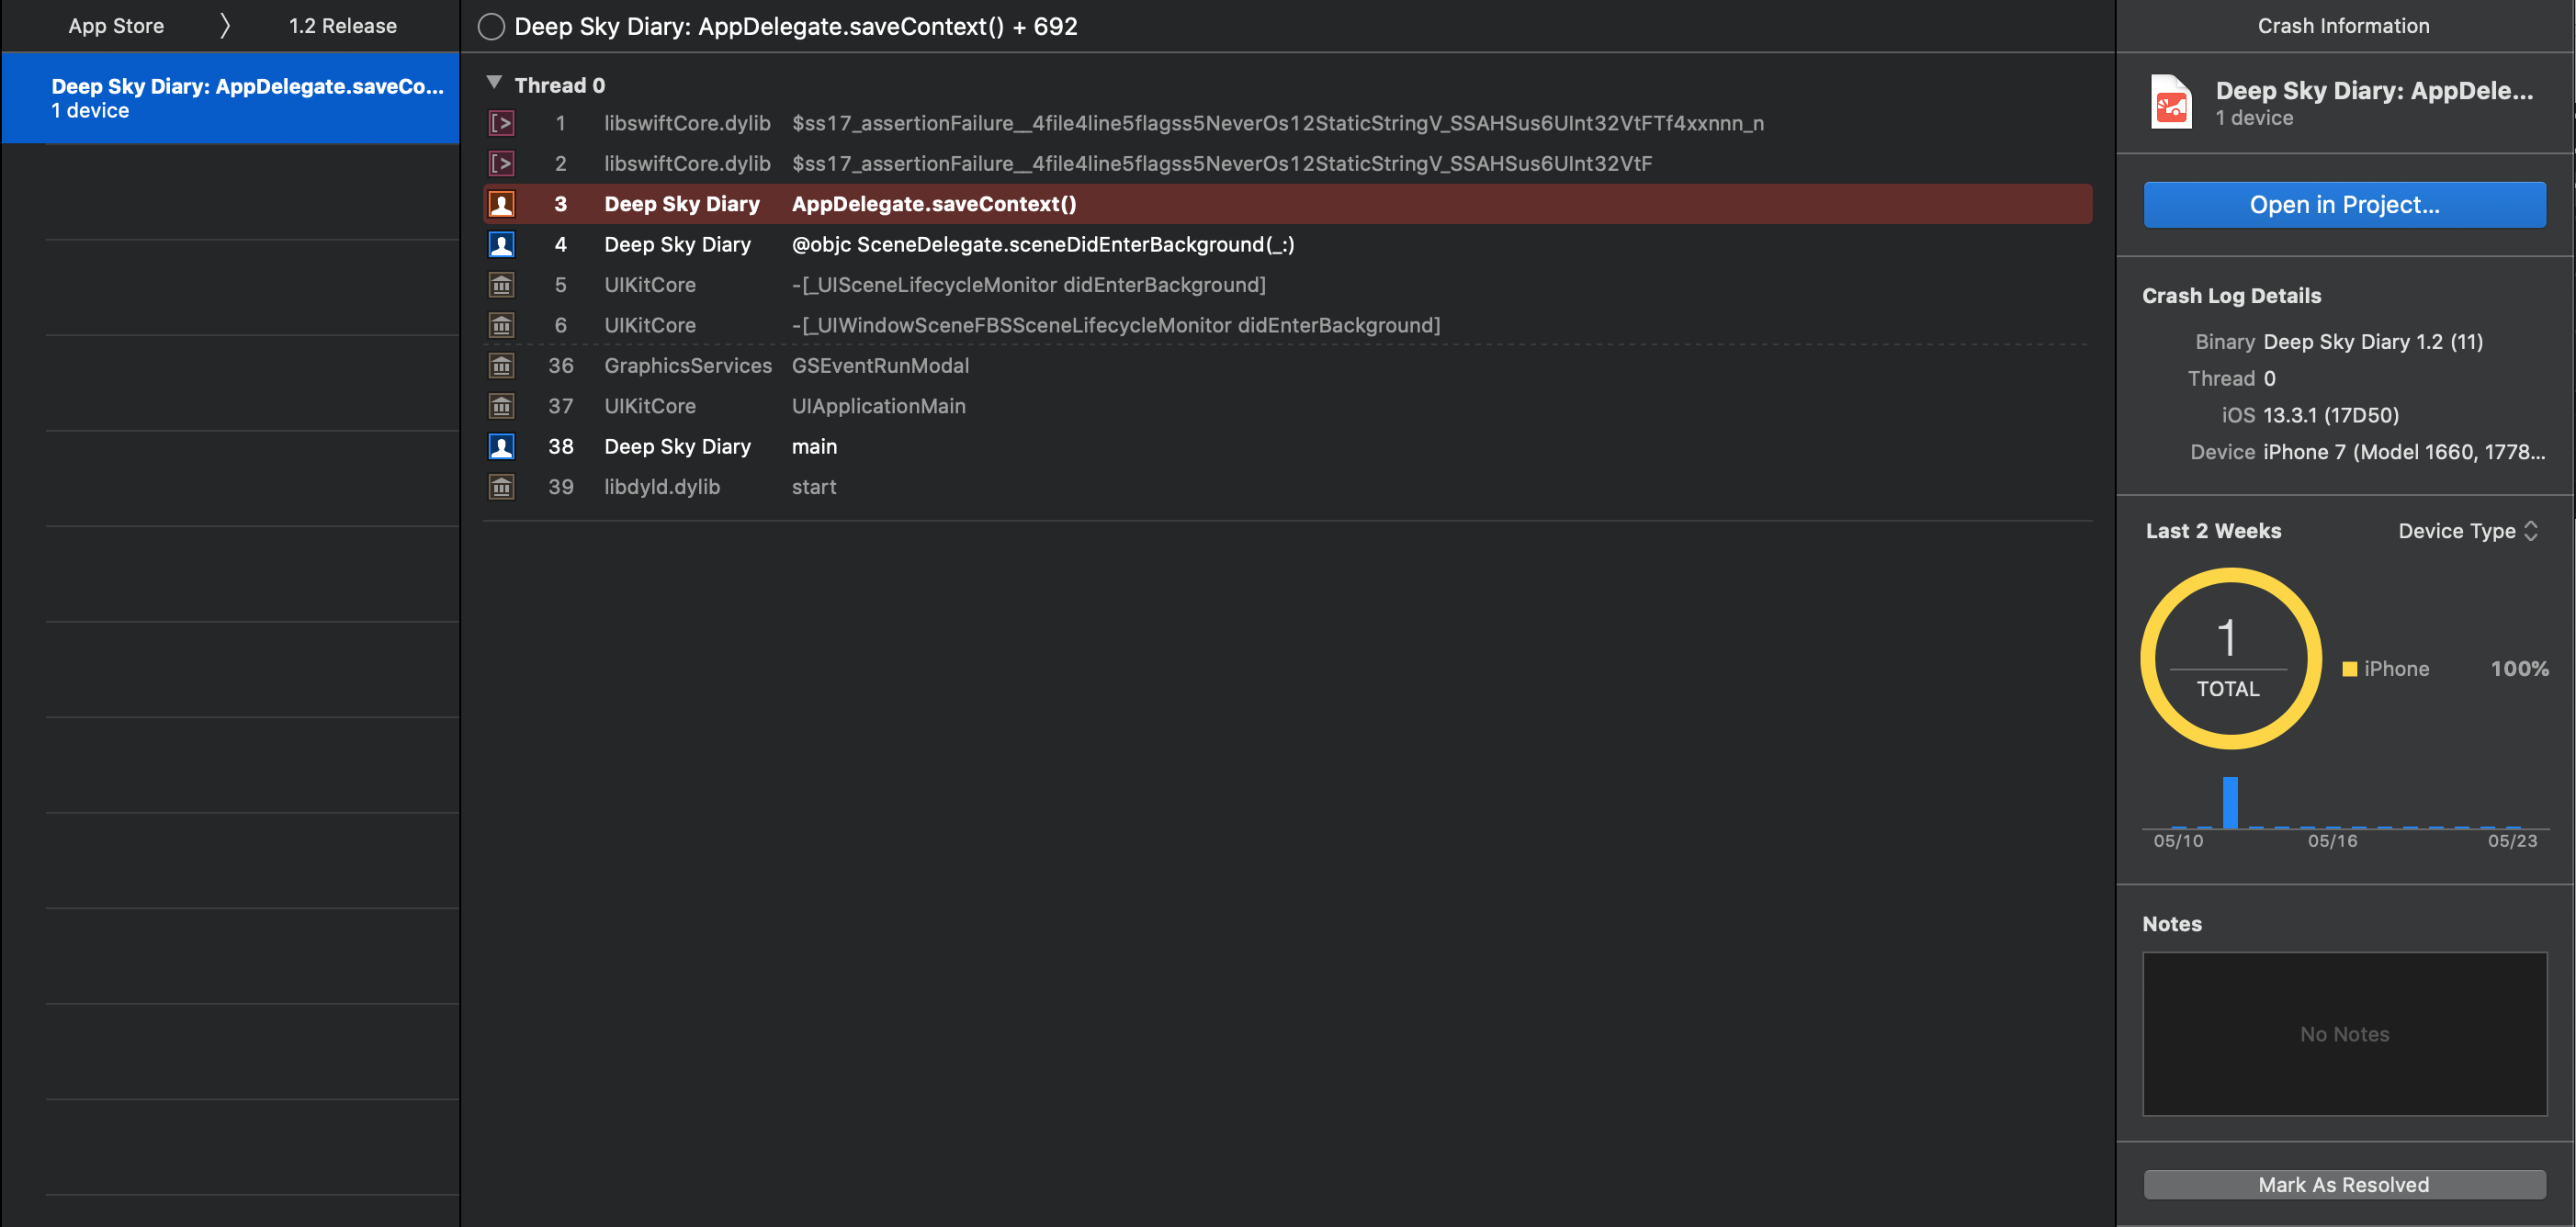
This article closes by reminding the reader to check metrics too, especially memory-related signals, because not every production problem first appears as a clean crash.
The article still holds up because it does not treat debugging as one tool or one screen. It is a ladder.
Start with logs when the question is simple. Use breakpoints when timing matters. Add conditions when only
one state is relevant. Use breakpoint actions when you need structured output without stopping. Move into
po when the program is paused and you want to interrogate the real runtime. And when the bug
only exists in shipped builds, switch to Organizer and work backward from the crash report.